实现跨应用链路追踪


在上篇文章使用 opentelemetry 与 jaeger 实现 flask 应用的链路追踪 | 那时难决 (duyixian.cn)中,我们介绍了如何使用 opentelemetry 与 jaeger 对 flask 应用进行链路跟踪。
在真实的业务场景下多个服务间互相调用是十分常见的,在进行一些问题排查的时候有必要跟踪一个请求链路在各个服务中细节。
使用 opentelemetry 与 jaeger 同样可以实现跨应用的链路追踪。
原理
进行链路跟踪的核心概念是 trace,trace 是一个具有开始时间和结束时间的操作,它可以包含若干个 span,形成一个树状结构。 每一个 trace 都有一个唯一的 traceId,用于标识一个请求链路。在跨服务的场景下,我们可以通过 traceId 将一个请求链路中的所有 span 关联起来。
回到上一篇文章的场景,编辑main.py,定义/headers路由,使用 requests 库请求 https://httpbin.org/headers ,返回 requests 发起请求时的 header 信息。
@app.get("/headers")
def headers():
    return requests.get("https://httpbin.org/headers").json()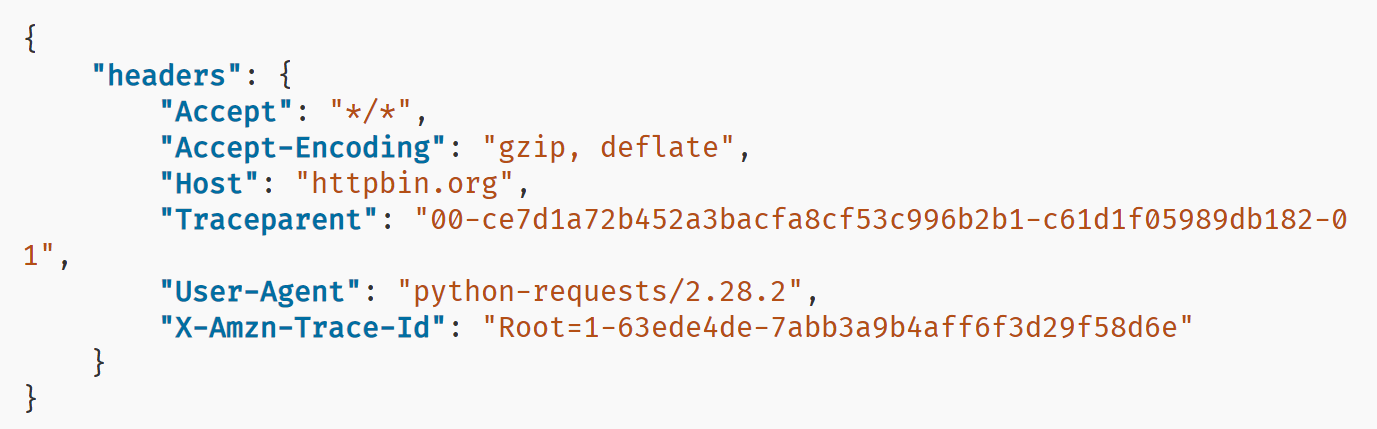
可以看到 headers 中有一个Traceparent,携带了 TraceId 信息。调用其他服务时,我们也需要将这个Traceparent传递给下游服务。
实现跨服务链路追踪
首先我们实现一个上游服务,用于演示跨应用链路追踪。这次我们使用 asyncio + FastAPI 来实现。asyncio 生态下的 httpx 和 fastapi 都有 opentelemetry 的支持。
先安装依赖:
pip install fastapi opentelemetry-instrumentation-fastapi
pip install httpx opentelemetry-instrumentation-httpx编辑upstream.py:
import fastapi
import httpx
from opentelemetry import trace
from opentelemetry.exporter.jaeger.thrift import JaegerExporter
from opentelemetry.instrumentation.fastapi import FastAPIInstrumentor
from opentelemetry.instrumentation.httpx import HTTPXClientInstrumentor
from opentelemetry.sdk.resources import SERVICE_NAME, Resource
from opentelemetry.sdk.trace import TracerProvider
from opentelemetry.sdk.trace.export import BatchSpanProcessor


def configure_trace(app: fastapi.FastAPI):
    trace.set_tracer_provider(
        TracerProvider(resource=Resource.create({SERVICE_NAME: app.title}))
    )

    trace.get_tracer_provider().add_span_processor(
        BatchSpanProcessor(
            JaegerExporter(
                agent_host_name="localhost",
                agent_port=6831,
            )
        )
    )

    FastAPIInstrumentor.instrument_app(app)
    HTTPXClientInstrumentor().instrument()


app = fastapi.FastAPI(title=__name__)
configure_trace(app)

def get_client():
    return httpx.AsyncClient()

@app.get("/api/check-baidu")
async def check_baidu(client: httpx.AsyncClient = fastapi.Depends(get_client)):
    resp = await client.head("https://www.baidu.com")
    return {"connected": resp.status_code == 200}
在upstream.py中,我们定义了一个 FastAPI 应用,它有一个/api/check-baidu路由,用于检查是否能够访问百度。
并且进行了 opentelemetry 和 jaeger 的初始化配置
接下来使用 uvicorn 启动upstream服务:
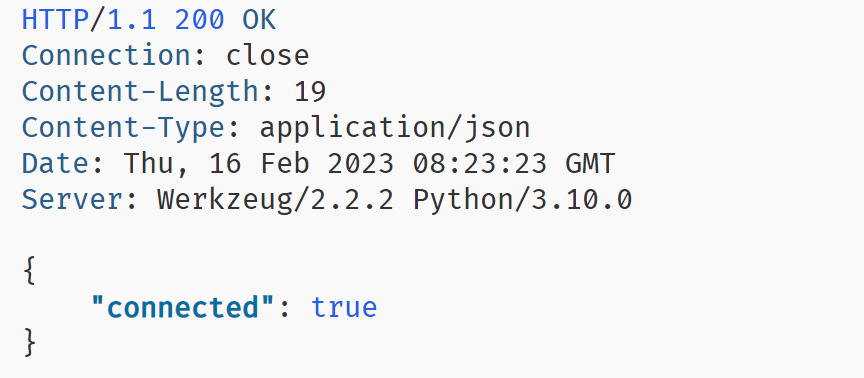
uvicorn upstream:app --port 5001 --reload编辑main.py,在/check路由中,使用 requests 库请求http://localhost:5001/api/check-baidu,返回请求结果。
@app.get("/check-baidu")
def check_baidu():
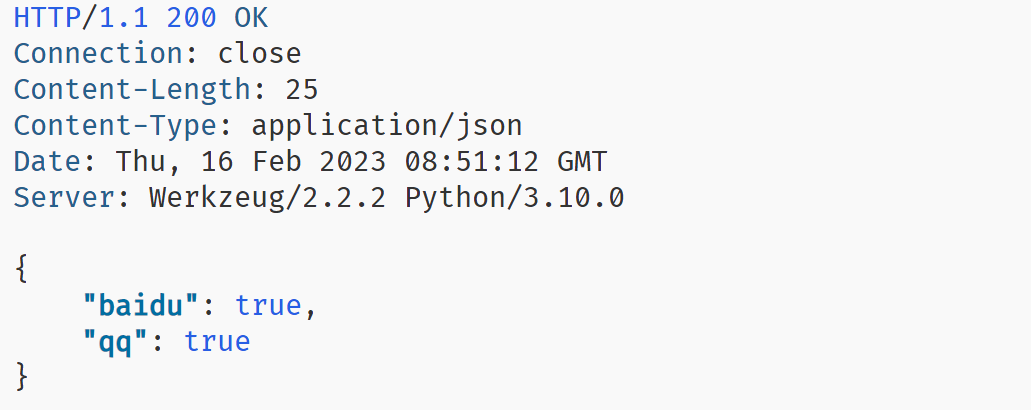
return requests.get("http://localhost:5001/api/check-baidu").json()访问 http://localhost:5000/check-baidu ,可以看到请求成功:
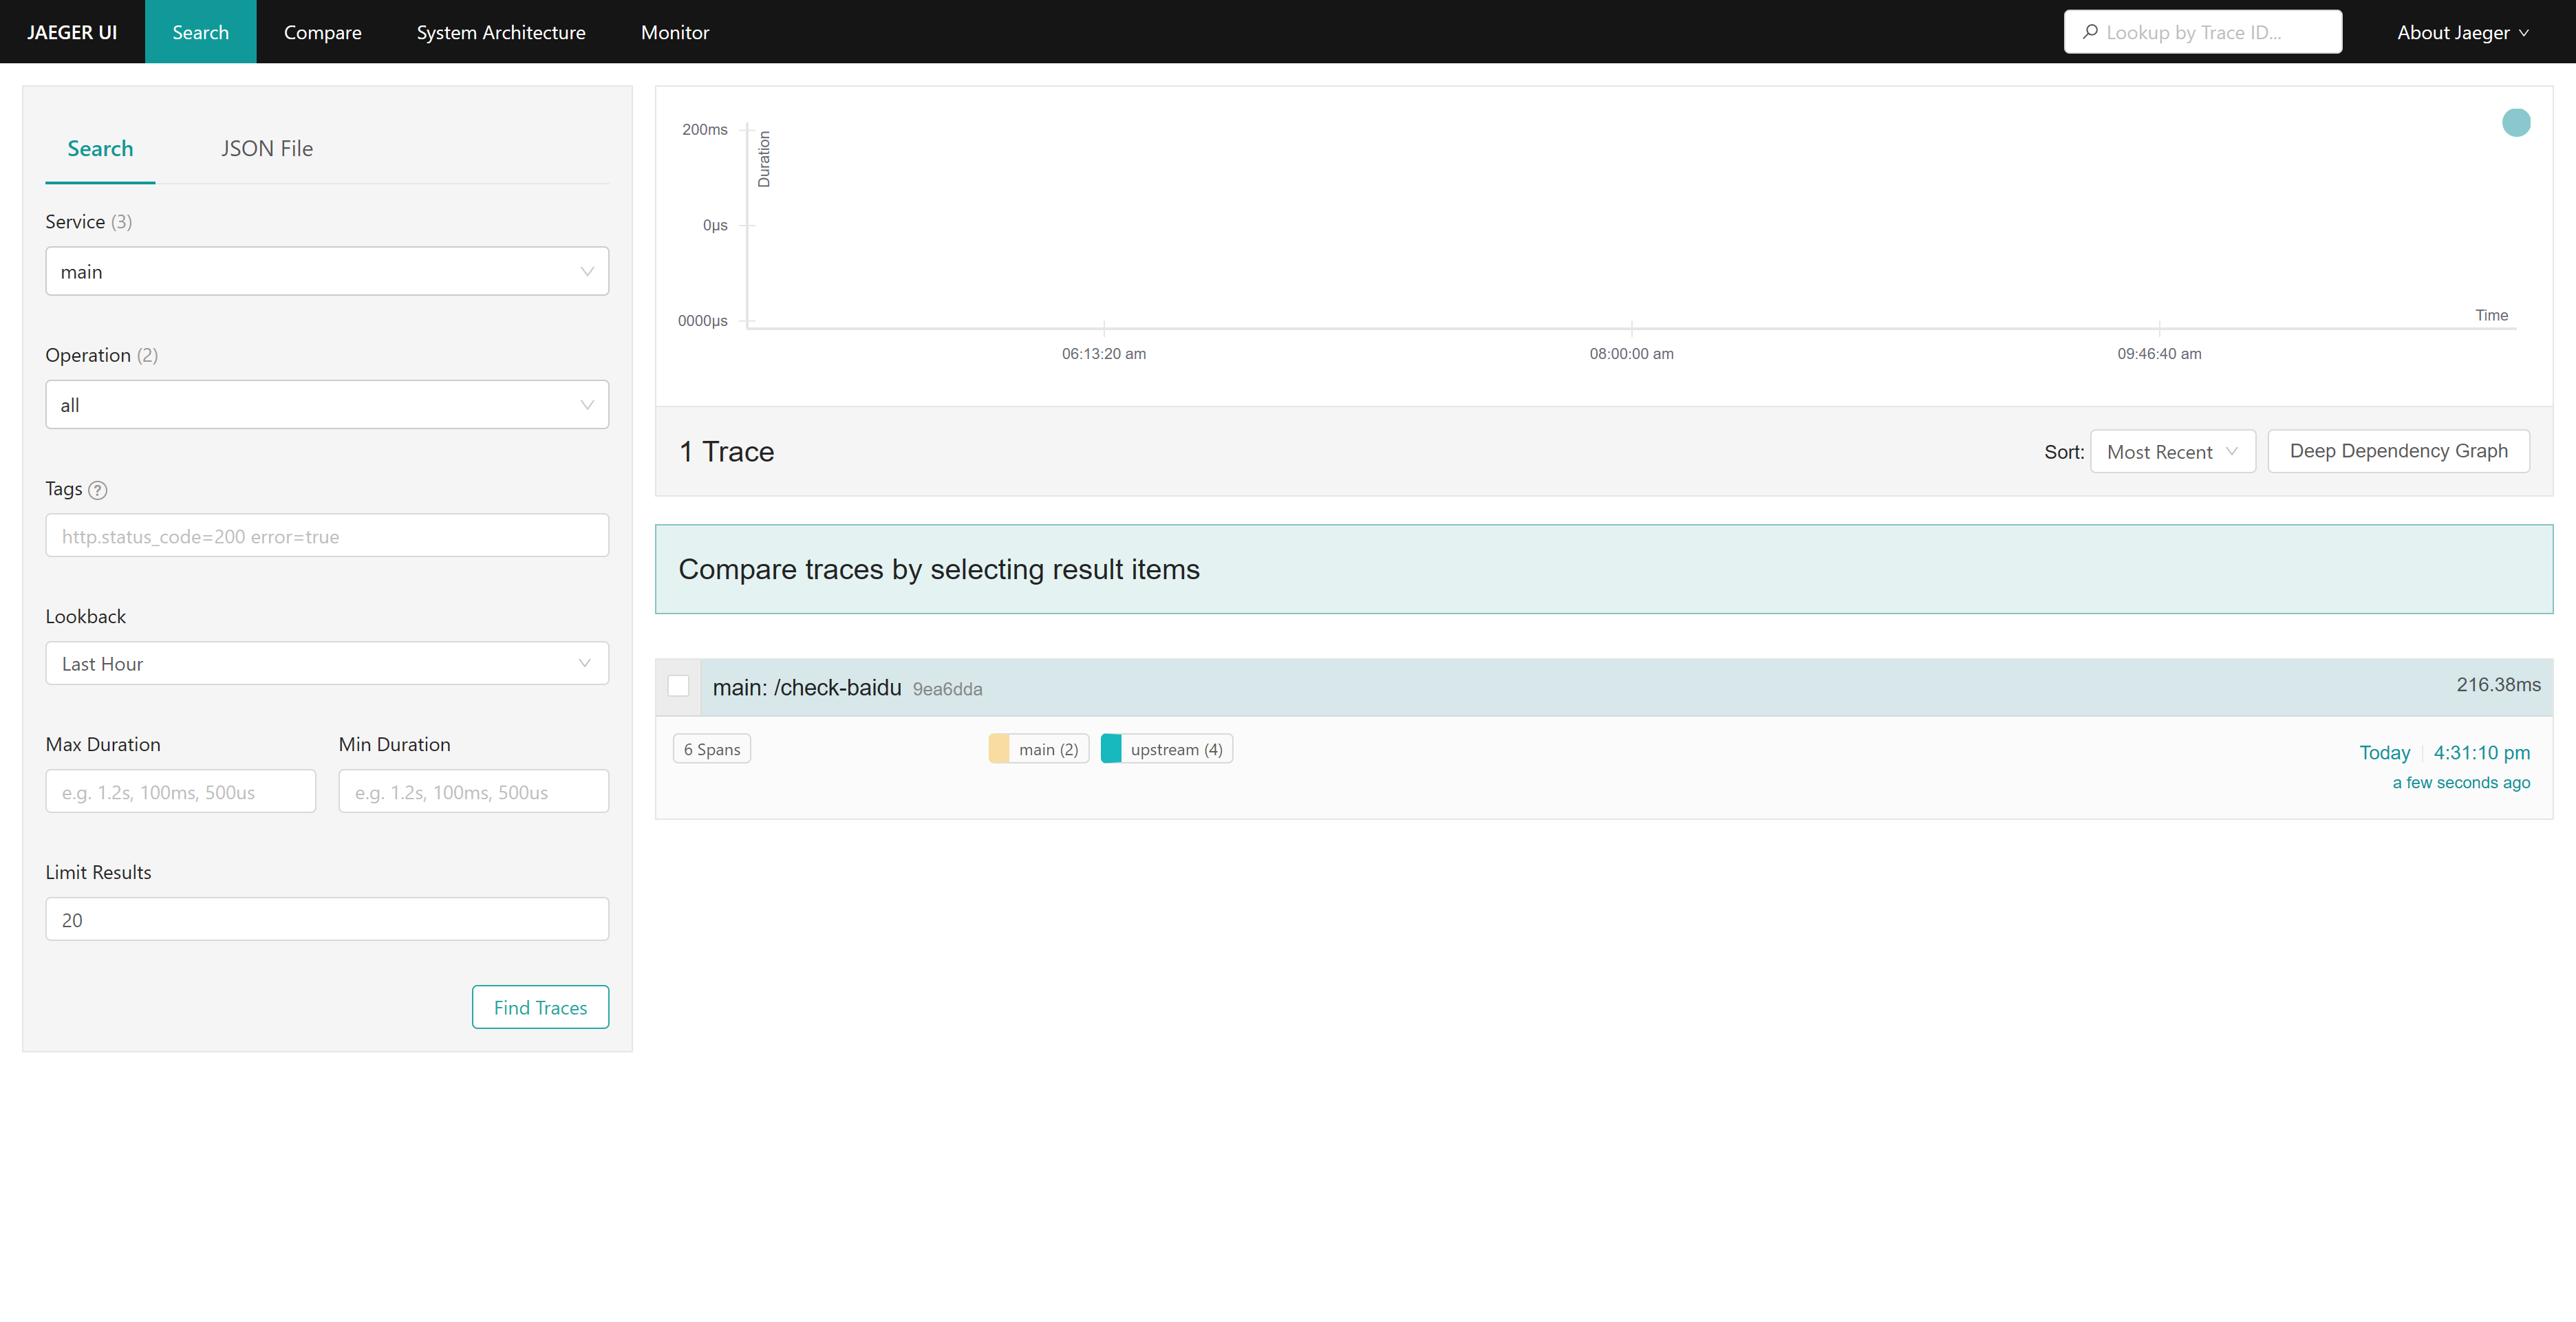
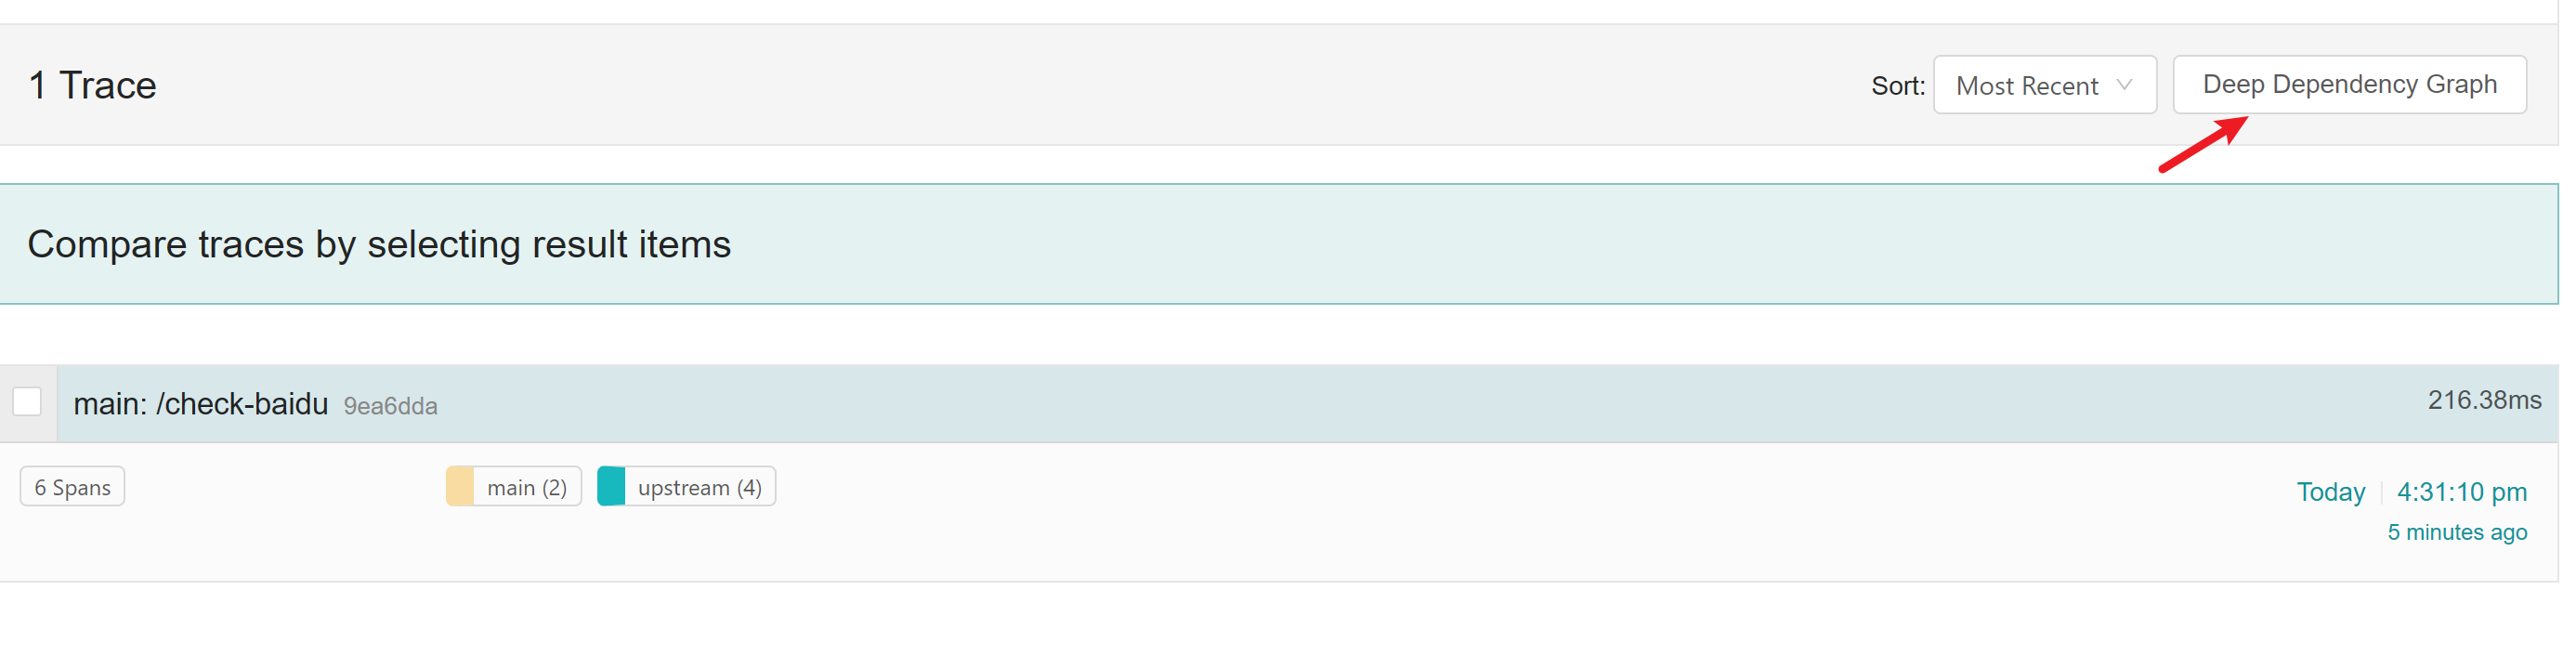
访问 Jaeger UI ,查看链路追踪信息:
查看 trace 详情:
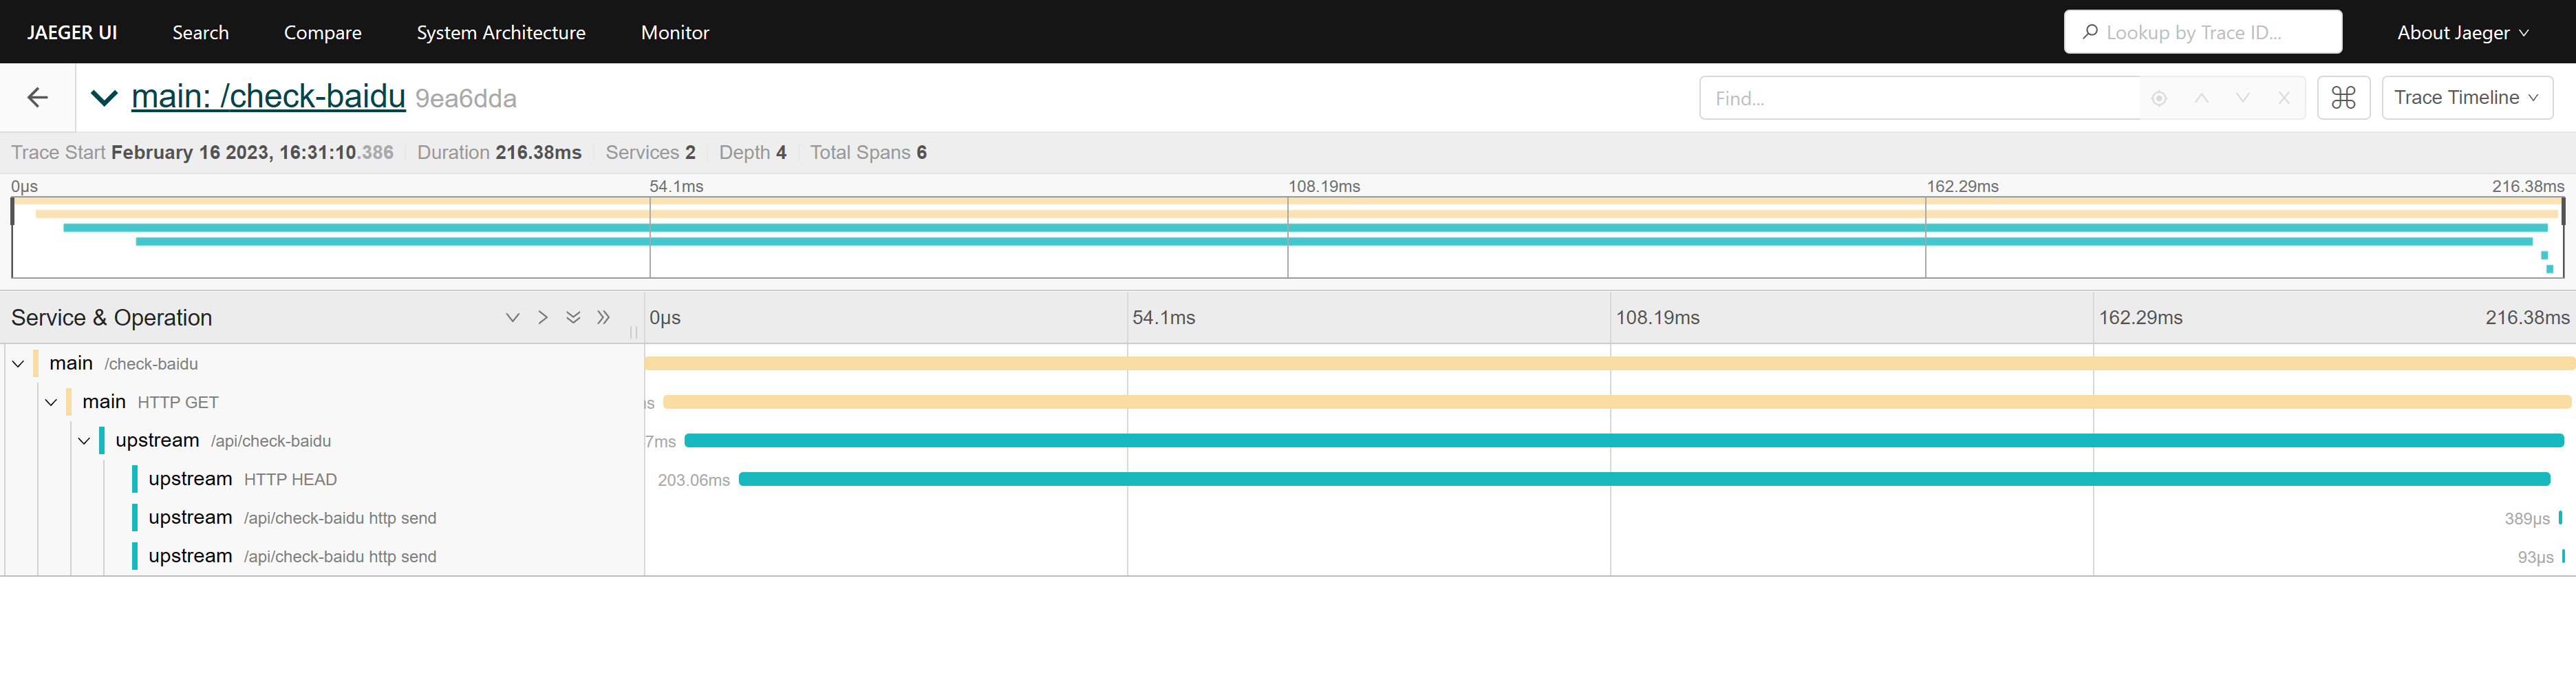
可以看到,我们的请求链路中包含了两个 span,分别是/check-baidu和/api/check-baidu,分别来自于两个服务。
从Jaeger UI也可以直接查看服务间的调用关系:
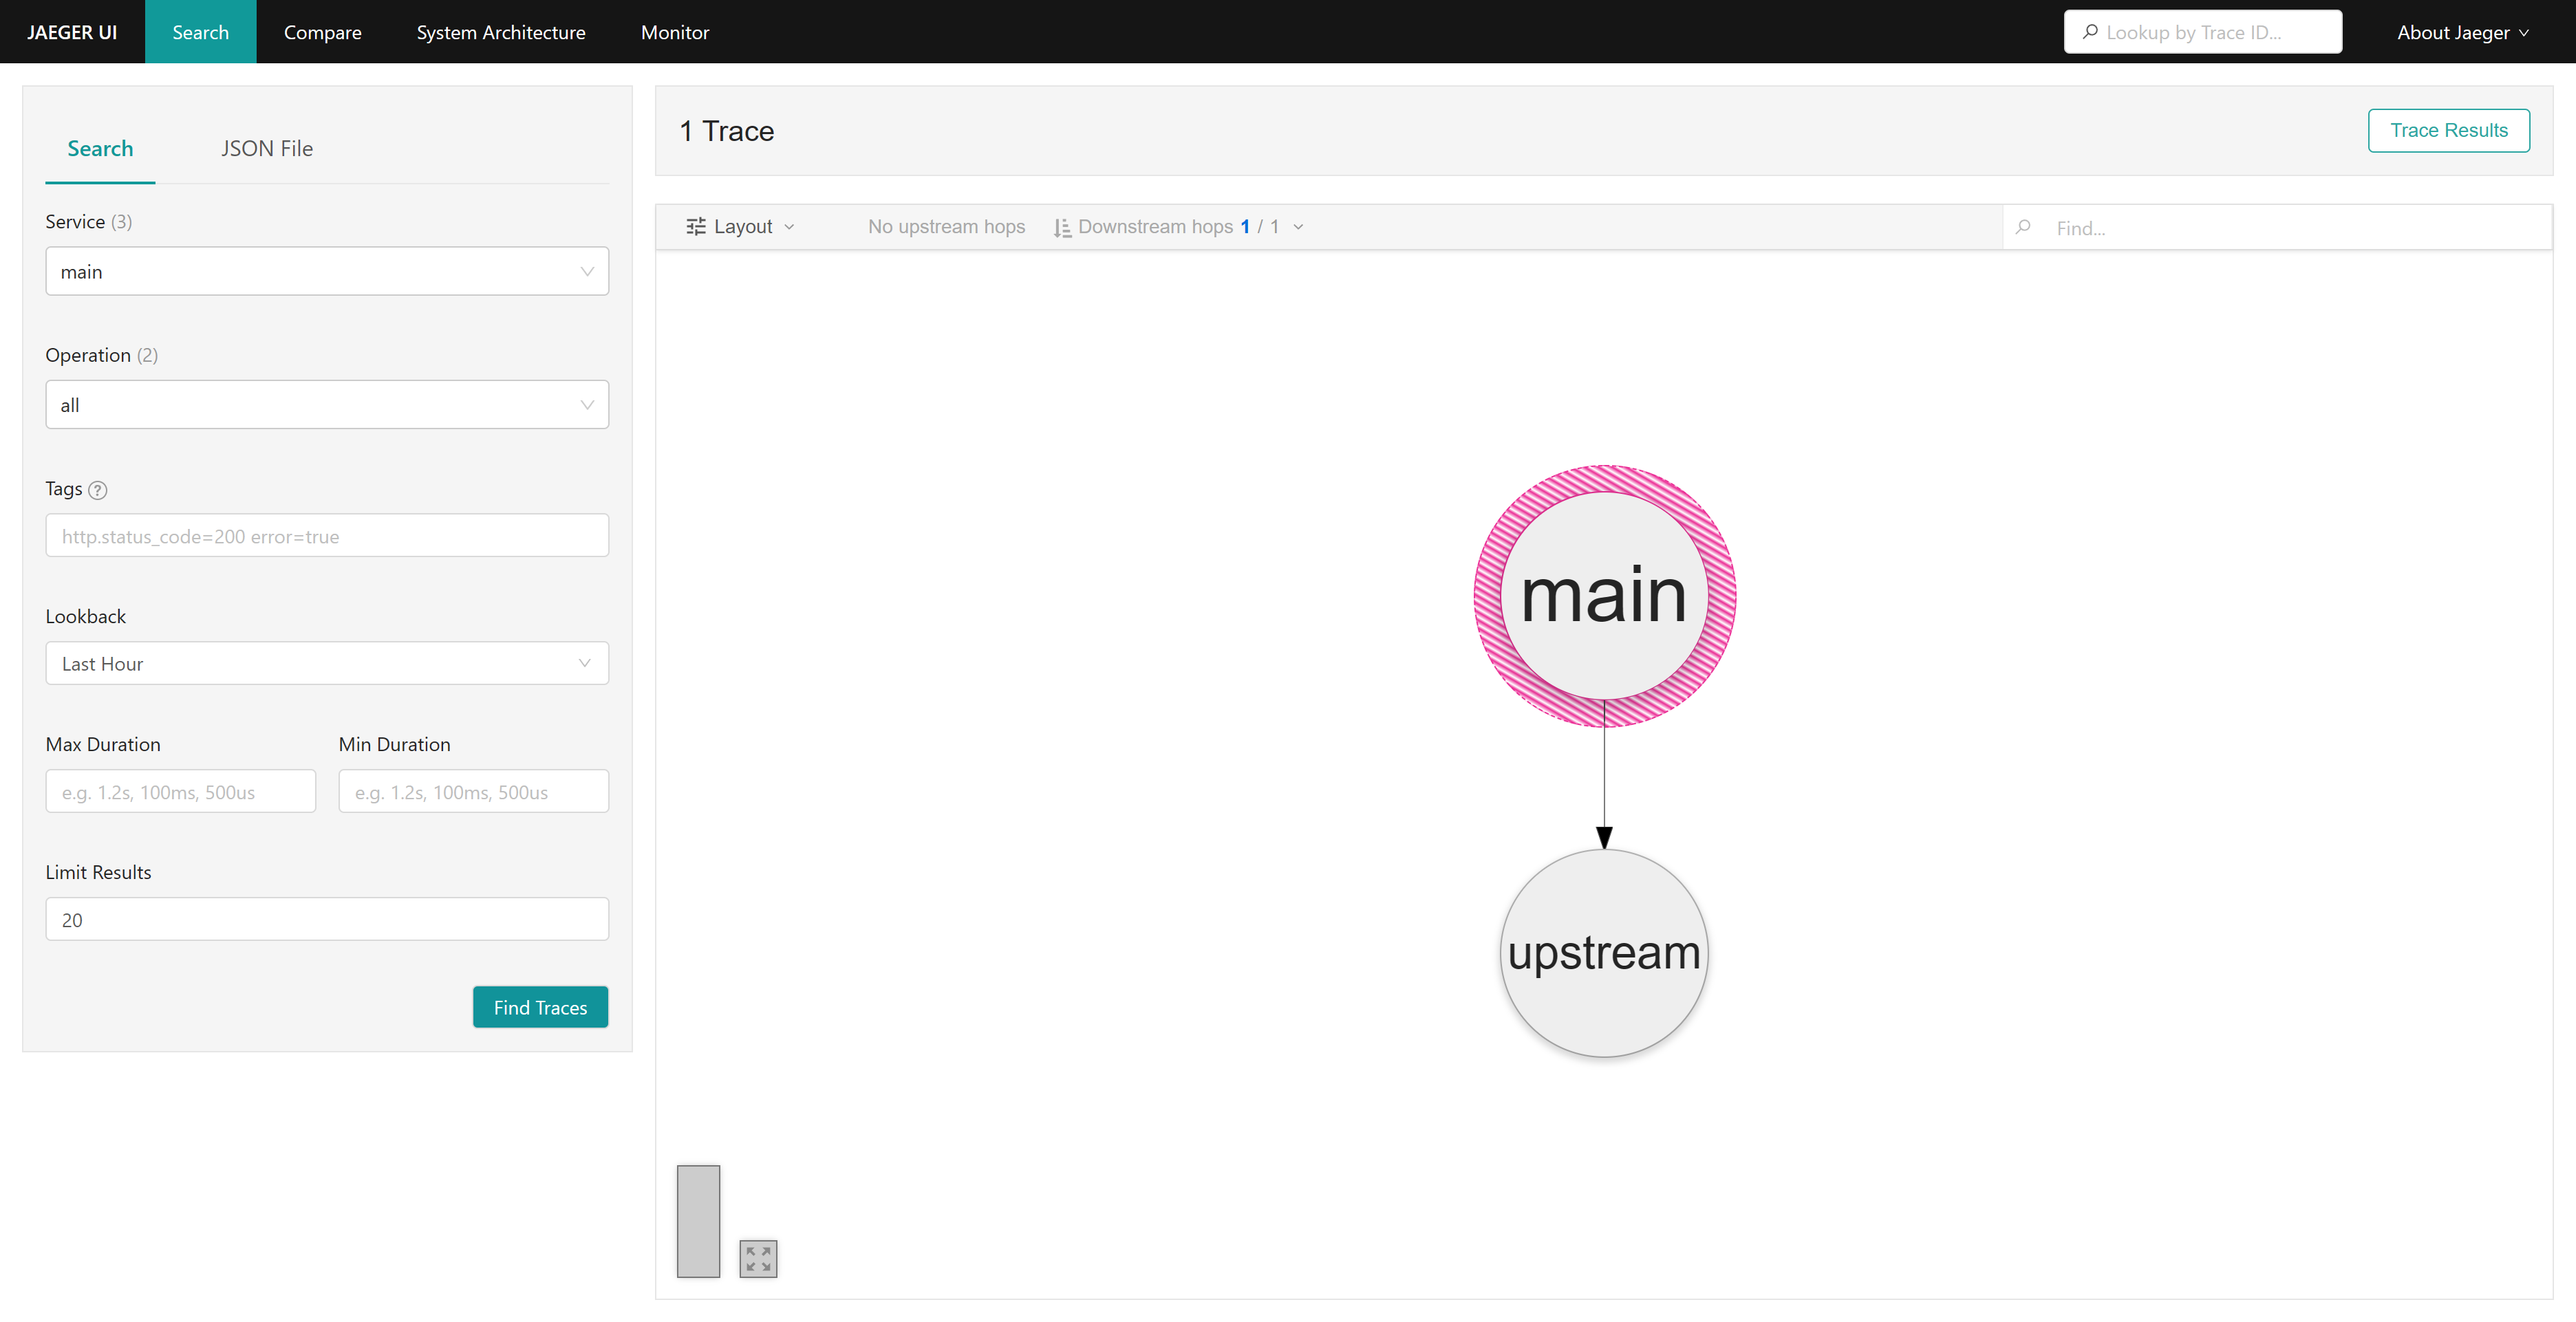
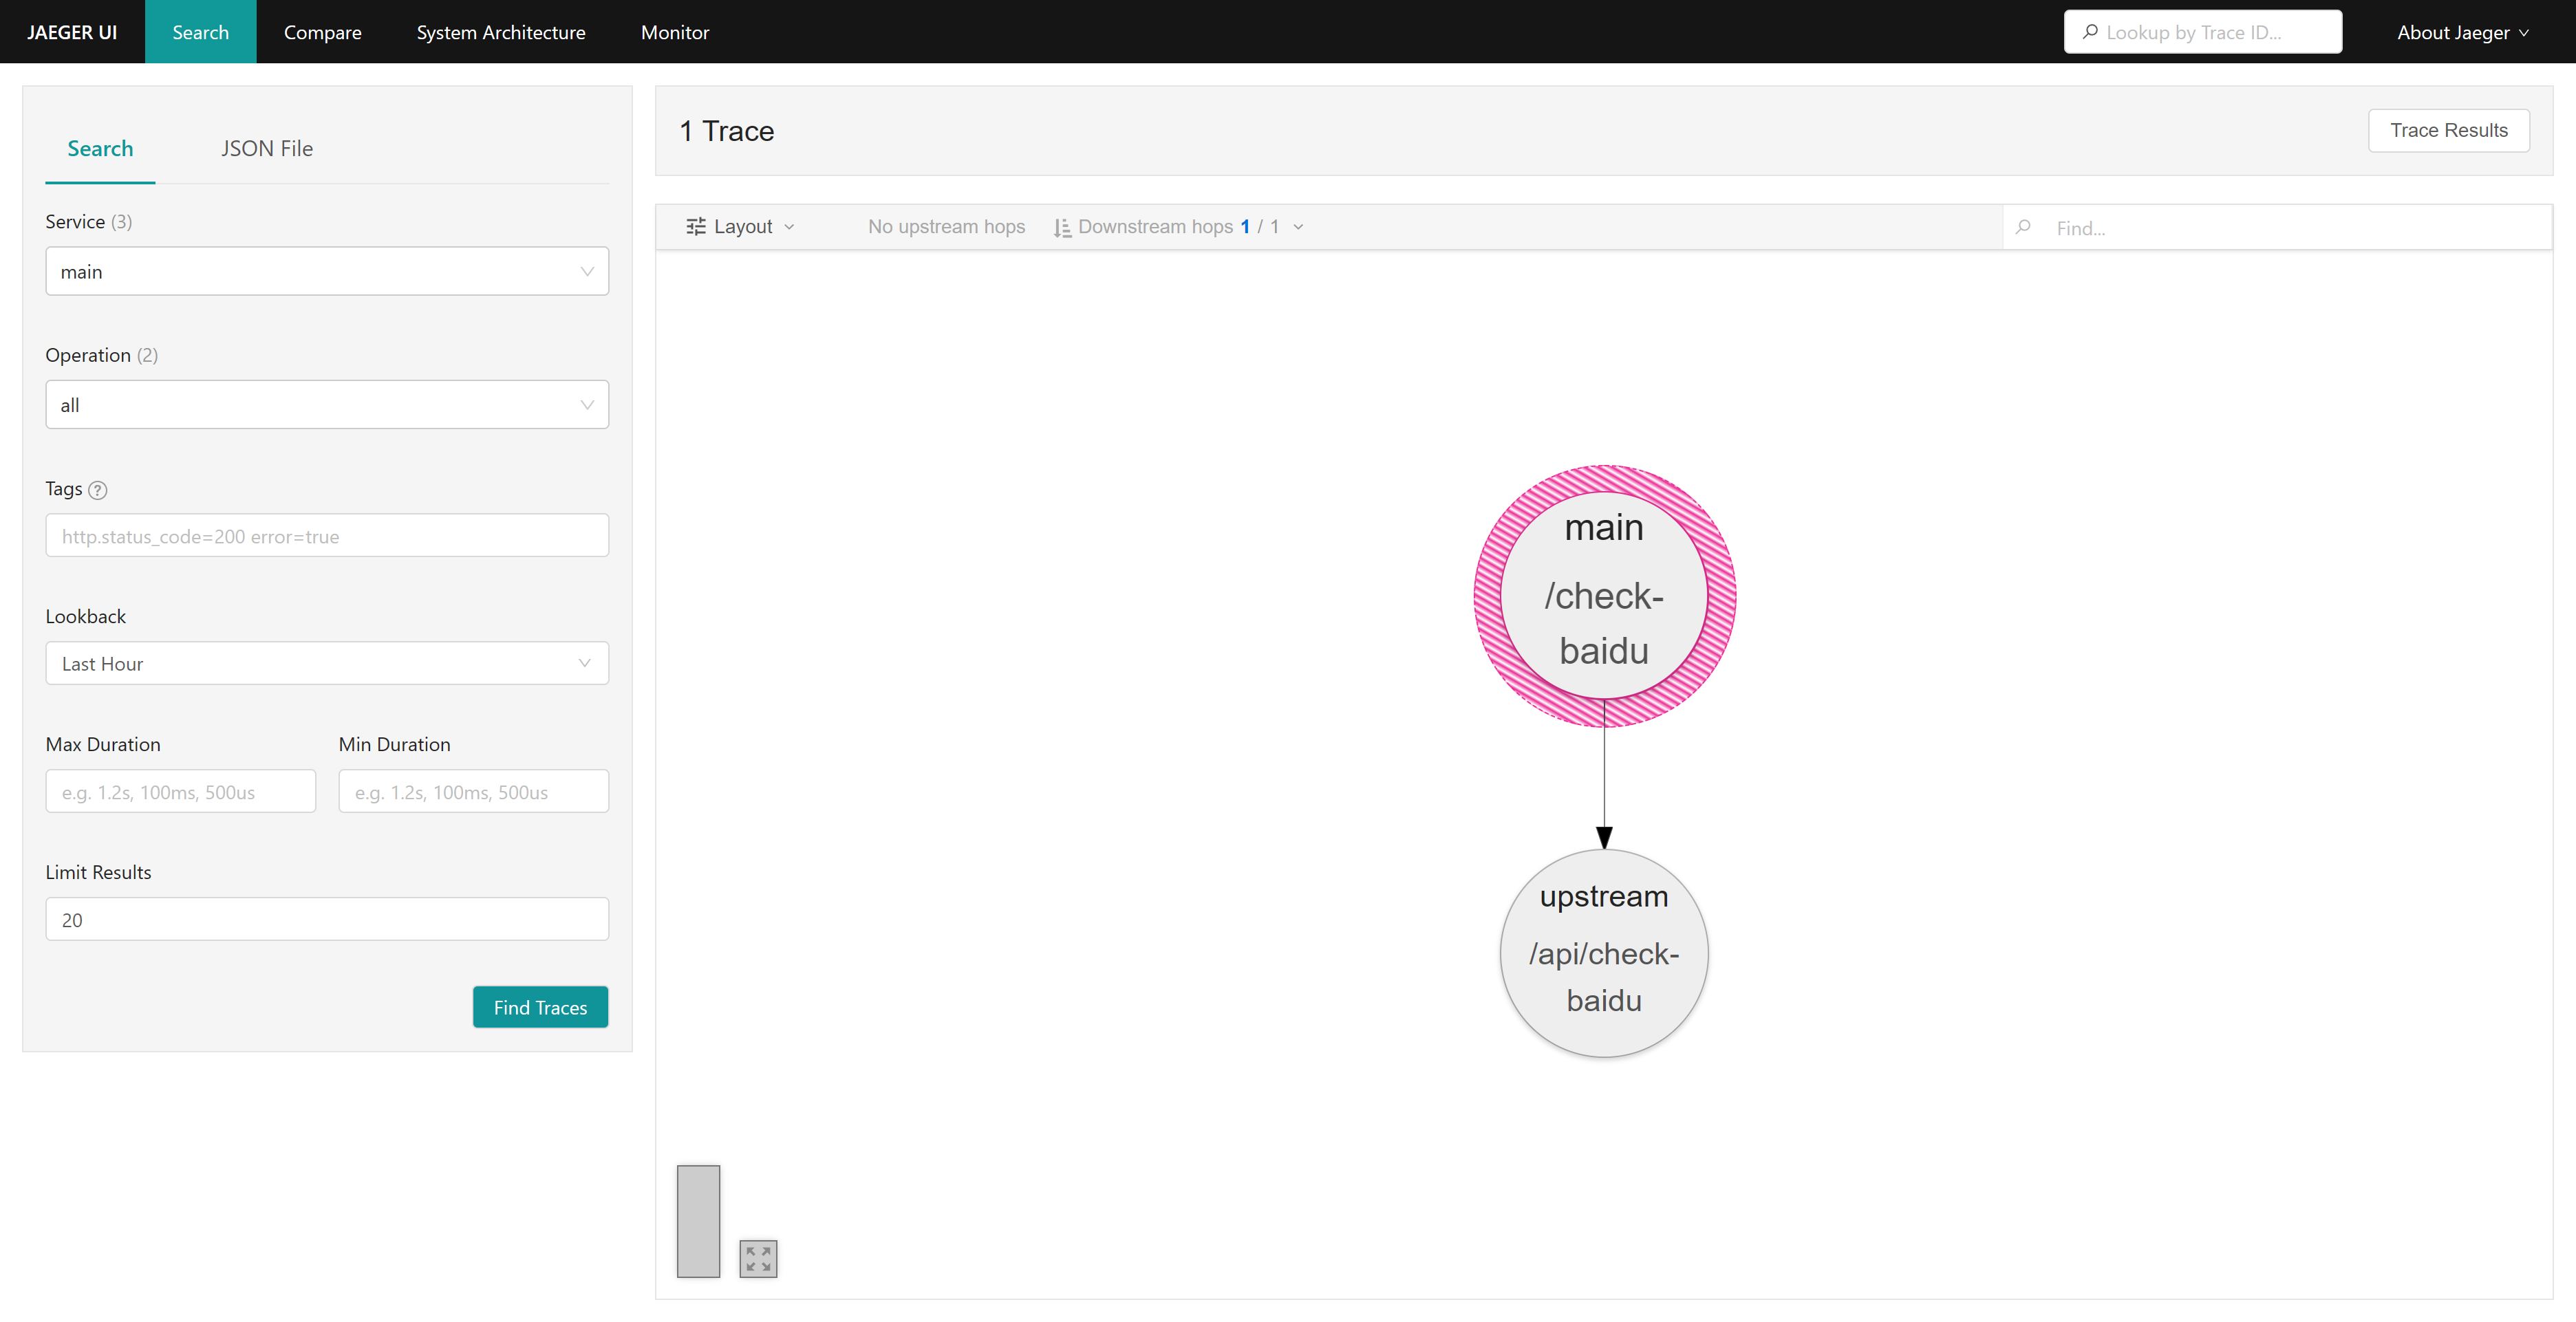
并且可以查看具体是哪些请求链路构成的服务间的调用关系(在 Layout 配置中开启 operations):
更复杂的场景
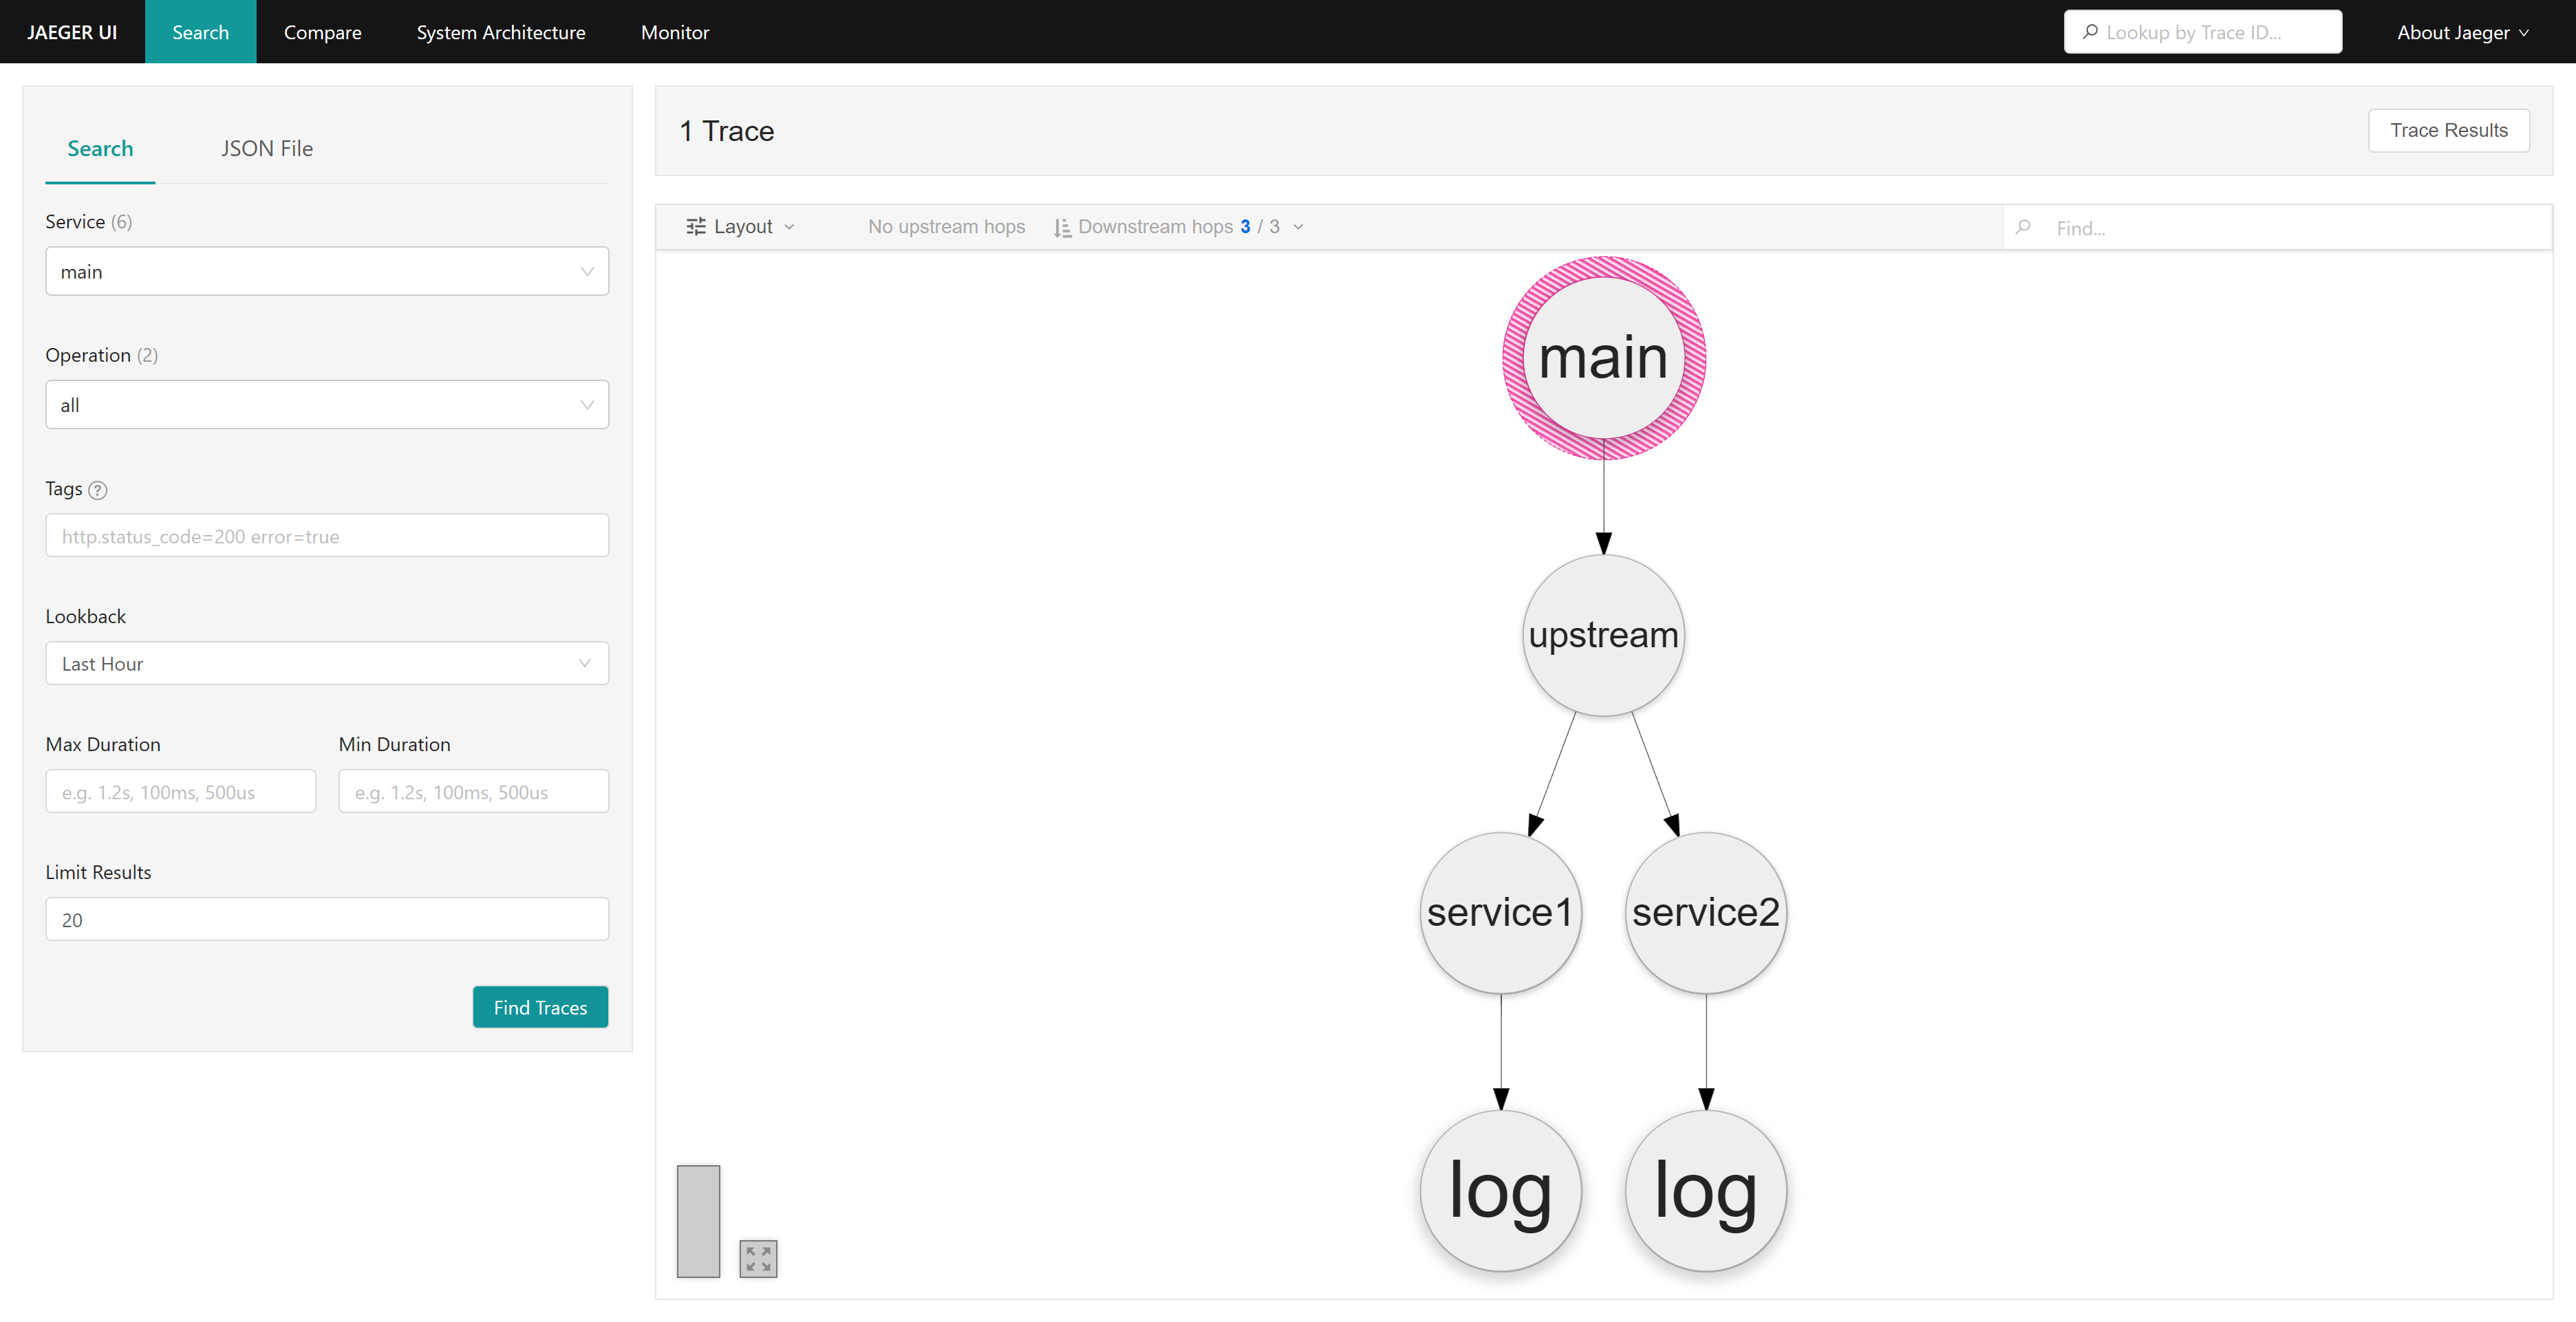
我们定义了五个服务,分别是main、upstream、service1、service2、log:
- main:主服务,提供
/check-sites路由,请求 upstream 服务的/api/check-sites接口。 - upstream:上游服务,提供
/api/check-sites路由,请求 service1 和 service2 服务的/api/check接口。 - services1 与 service2:提供
/api/check路由,分别检查百度和腾讯网的可连接性,在请求中请求 log 服务的/api/log接口。 - log:提供
/api/log路由,持久化 services1 与 service2 的请求日志。
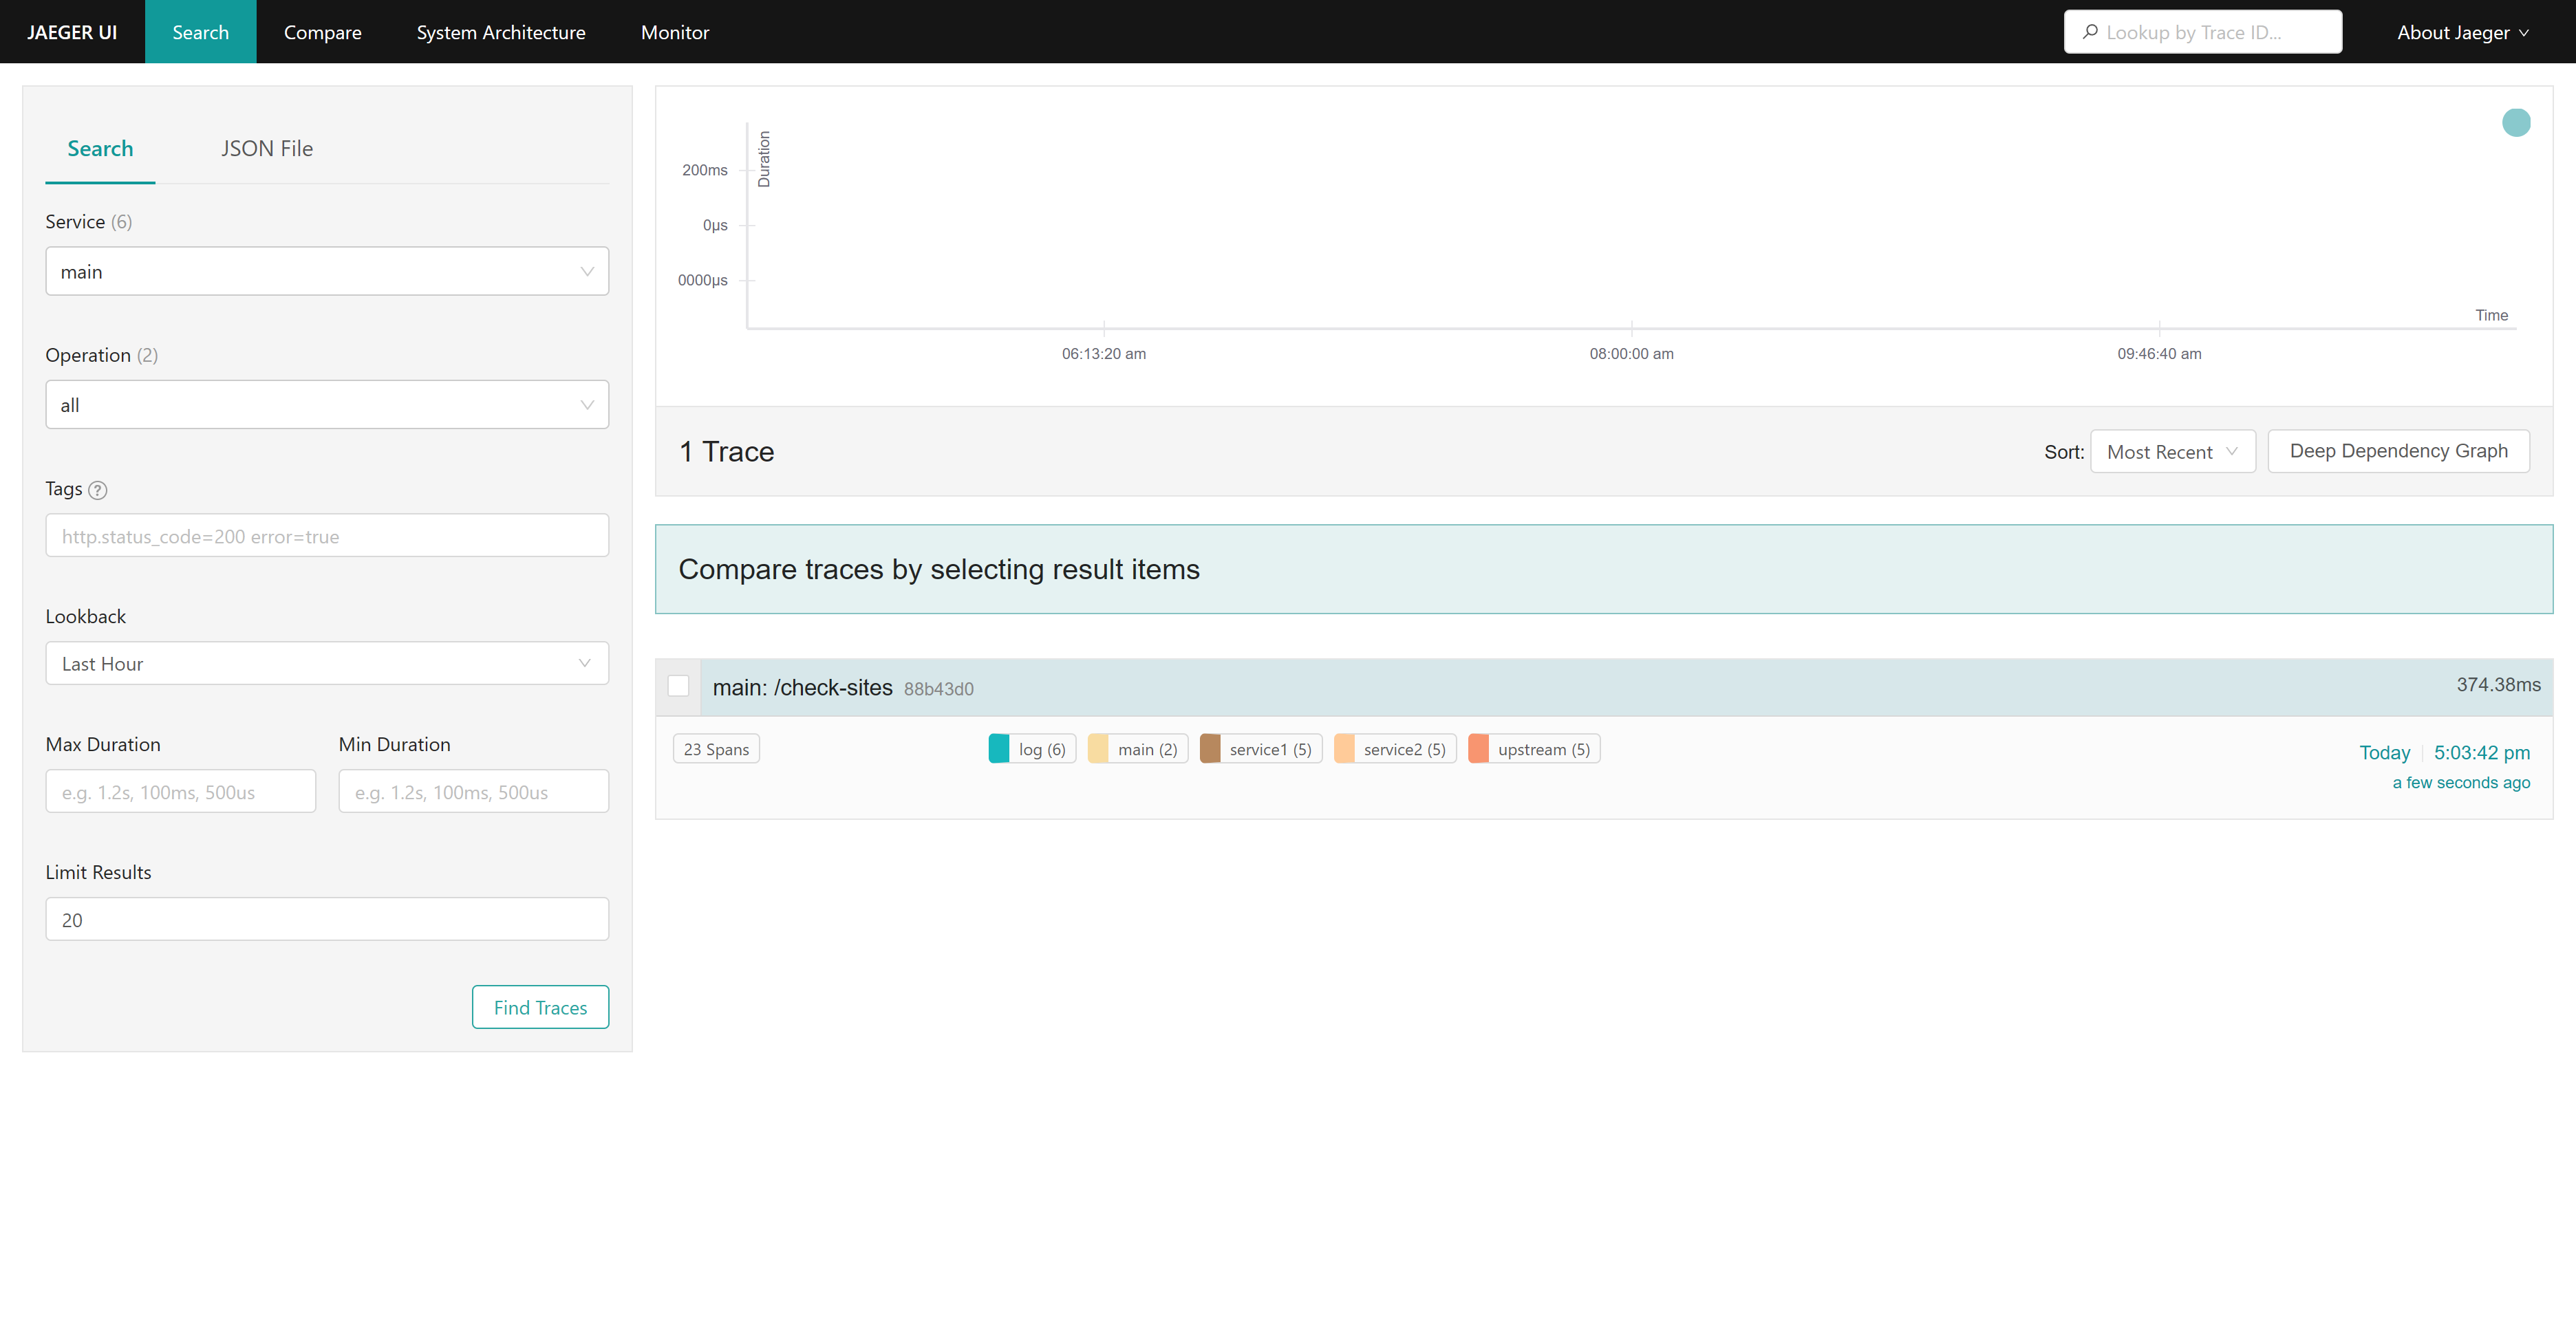
访问 main 服务的/check-sites路由,可以看到请求成功:
刷新 Jaeger UI ,查看链路追踪信息:
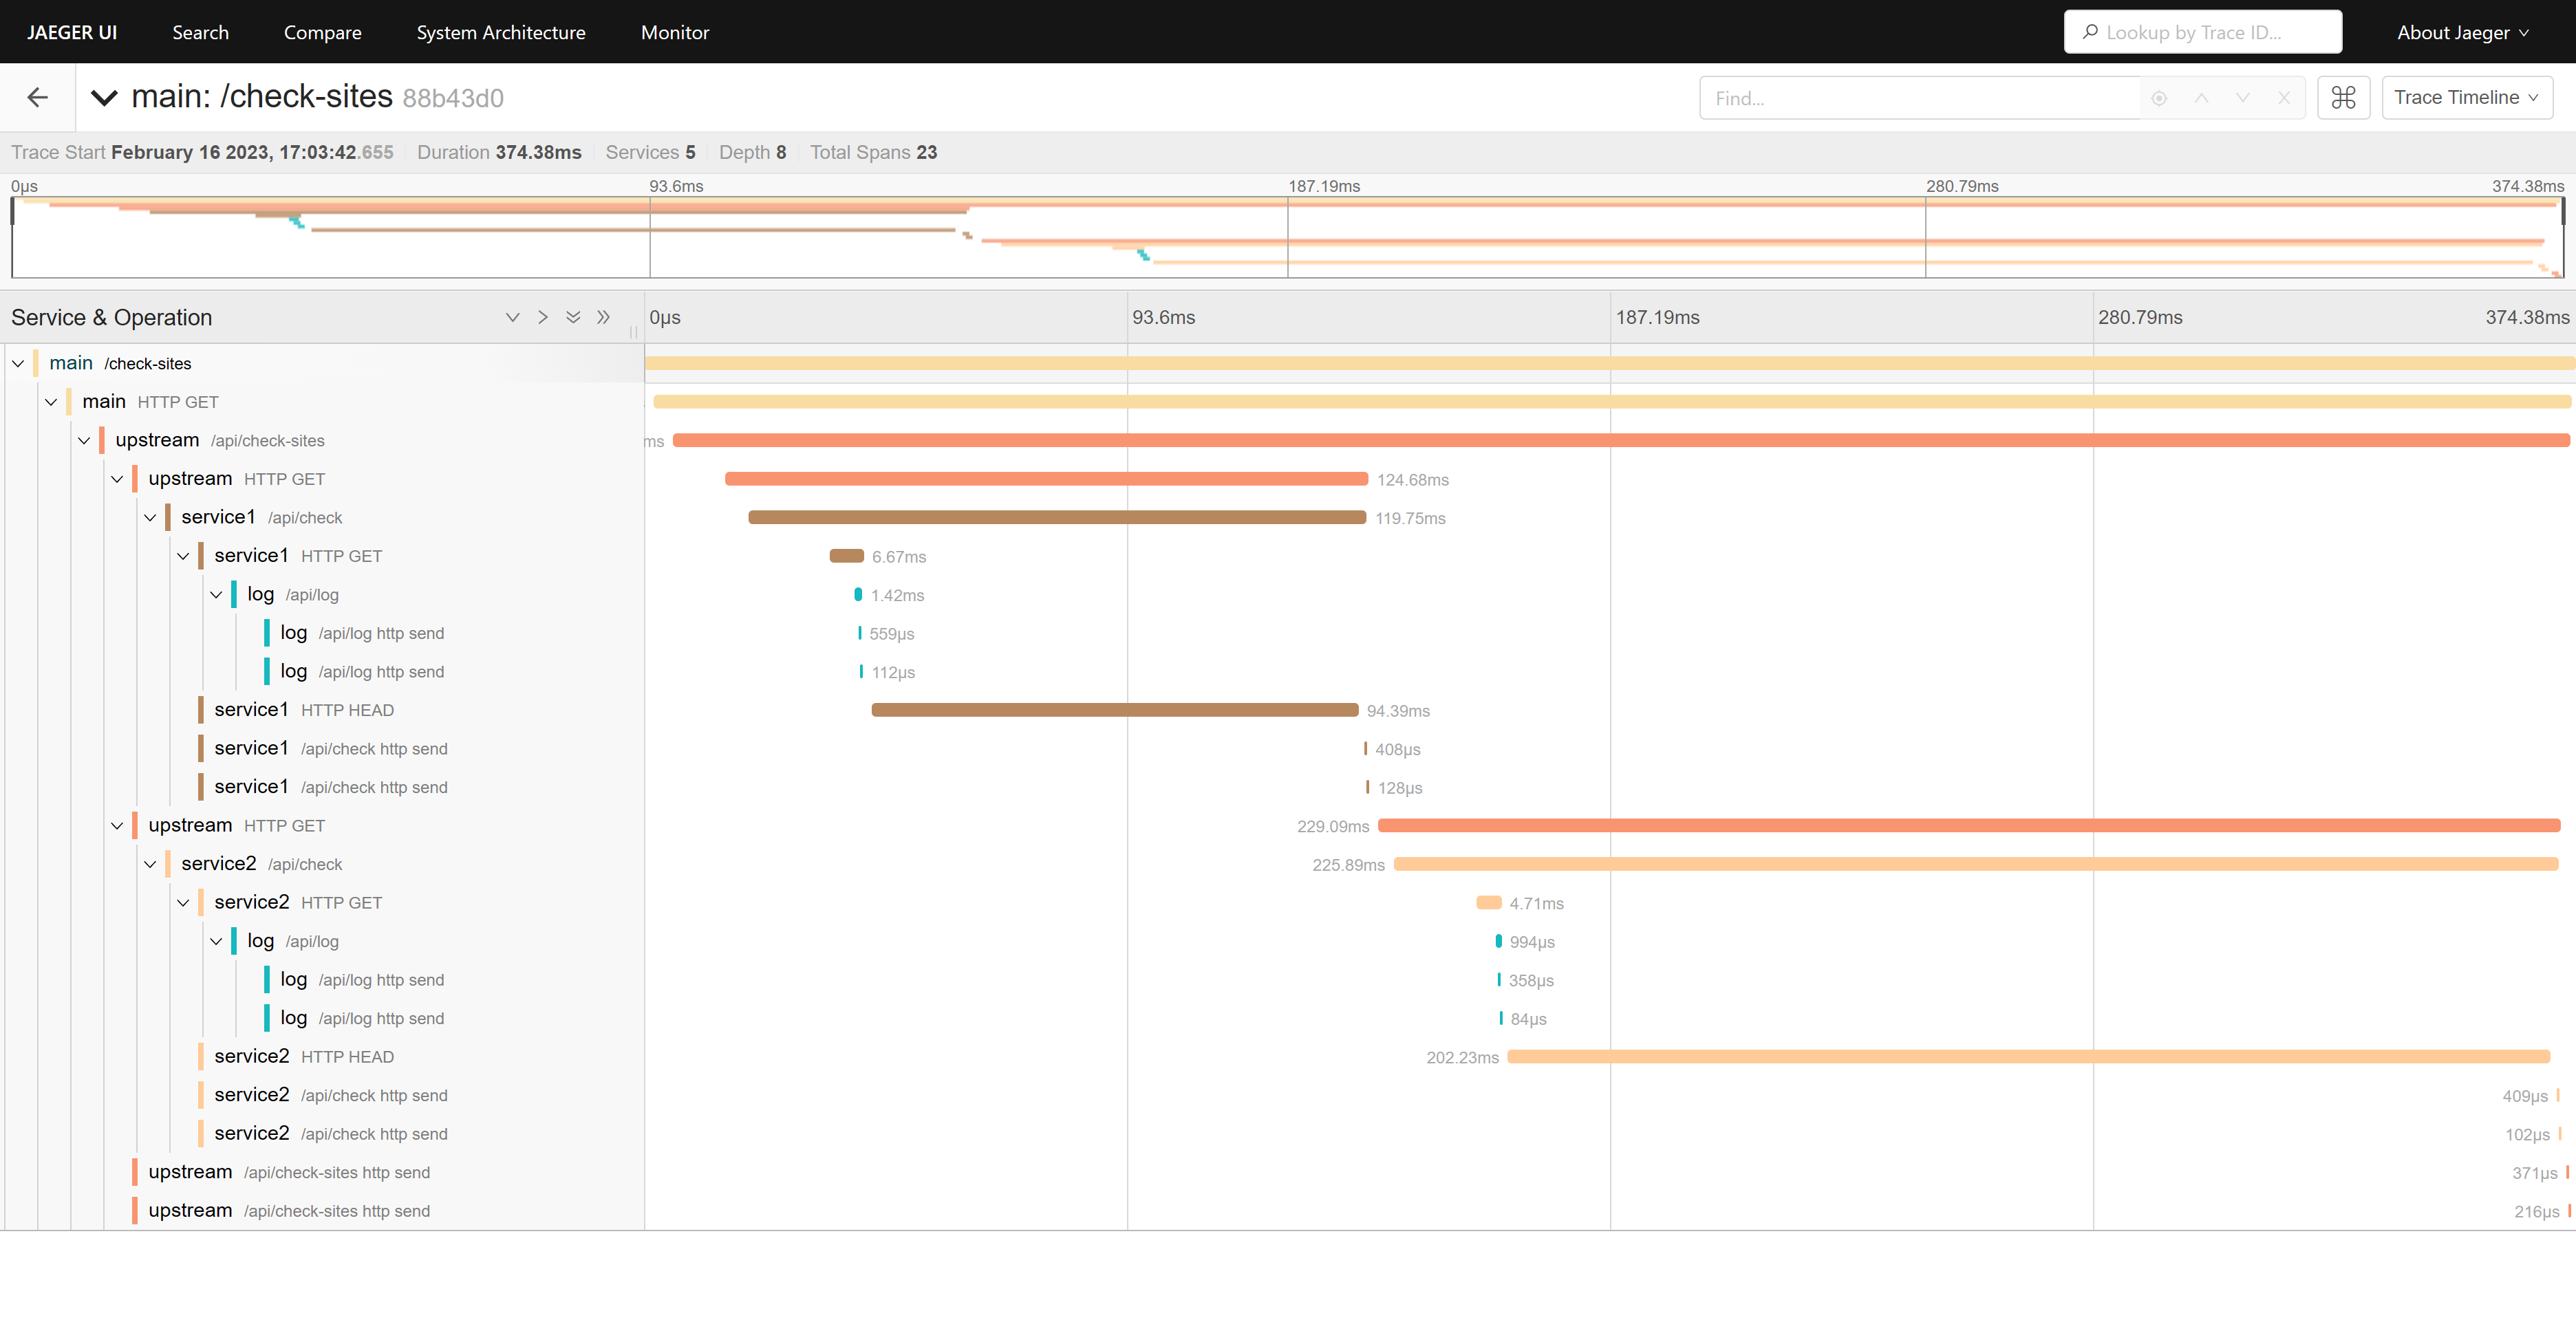
从 trace 信息中可以直观了解到请求链路的细节,比如 upstream 两次请求 service1 和 service2 服务的/api/check接口是串行的,改成并行的话可以有效减少请求时间。
@app.get("/api/check-sites")
async def check_sites(client: httpx.AsyncClient = fastapi.Depends(get_client)):
    baidu = (await client.get("http://localhost:5002/api/check")).json()['connected']
    qq = (await client.get("http://localhost:5003/api/check")).json()['connected']
    return {"baidu": baidu, "qq": qq}

@app.get("/api/check-sites-v2")
async def check_sites_v2(client: httpx.AsyncClient = fastapi.Depends(get_client)):
    baidu , qq = await asyncio.gather(check("baidu",client),check("qq",client))
    return {"baidu": baidu, "qq": qq}

async def check(site:str,client: httpx.AsyncClient):
    match site:
        case "baidu":
            return (await client.get("http://localhost:5002/api/check")).json()['connected']
        case "qq":
            return (await client.get("http://localhost:5003/api/check")).json()['connected']
        case _:
            return False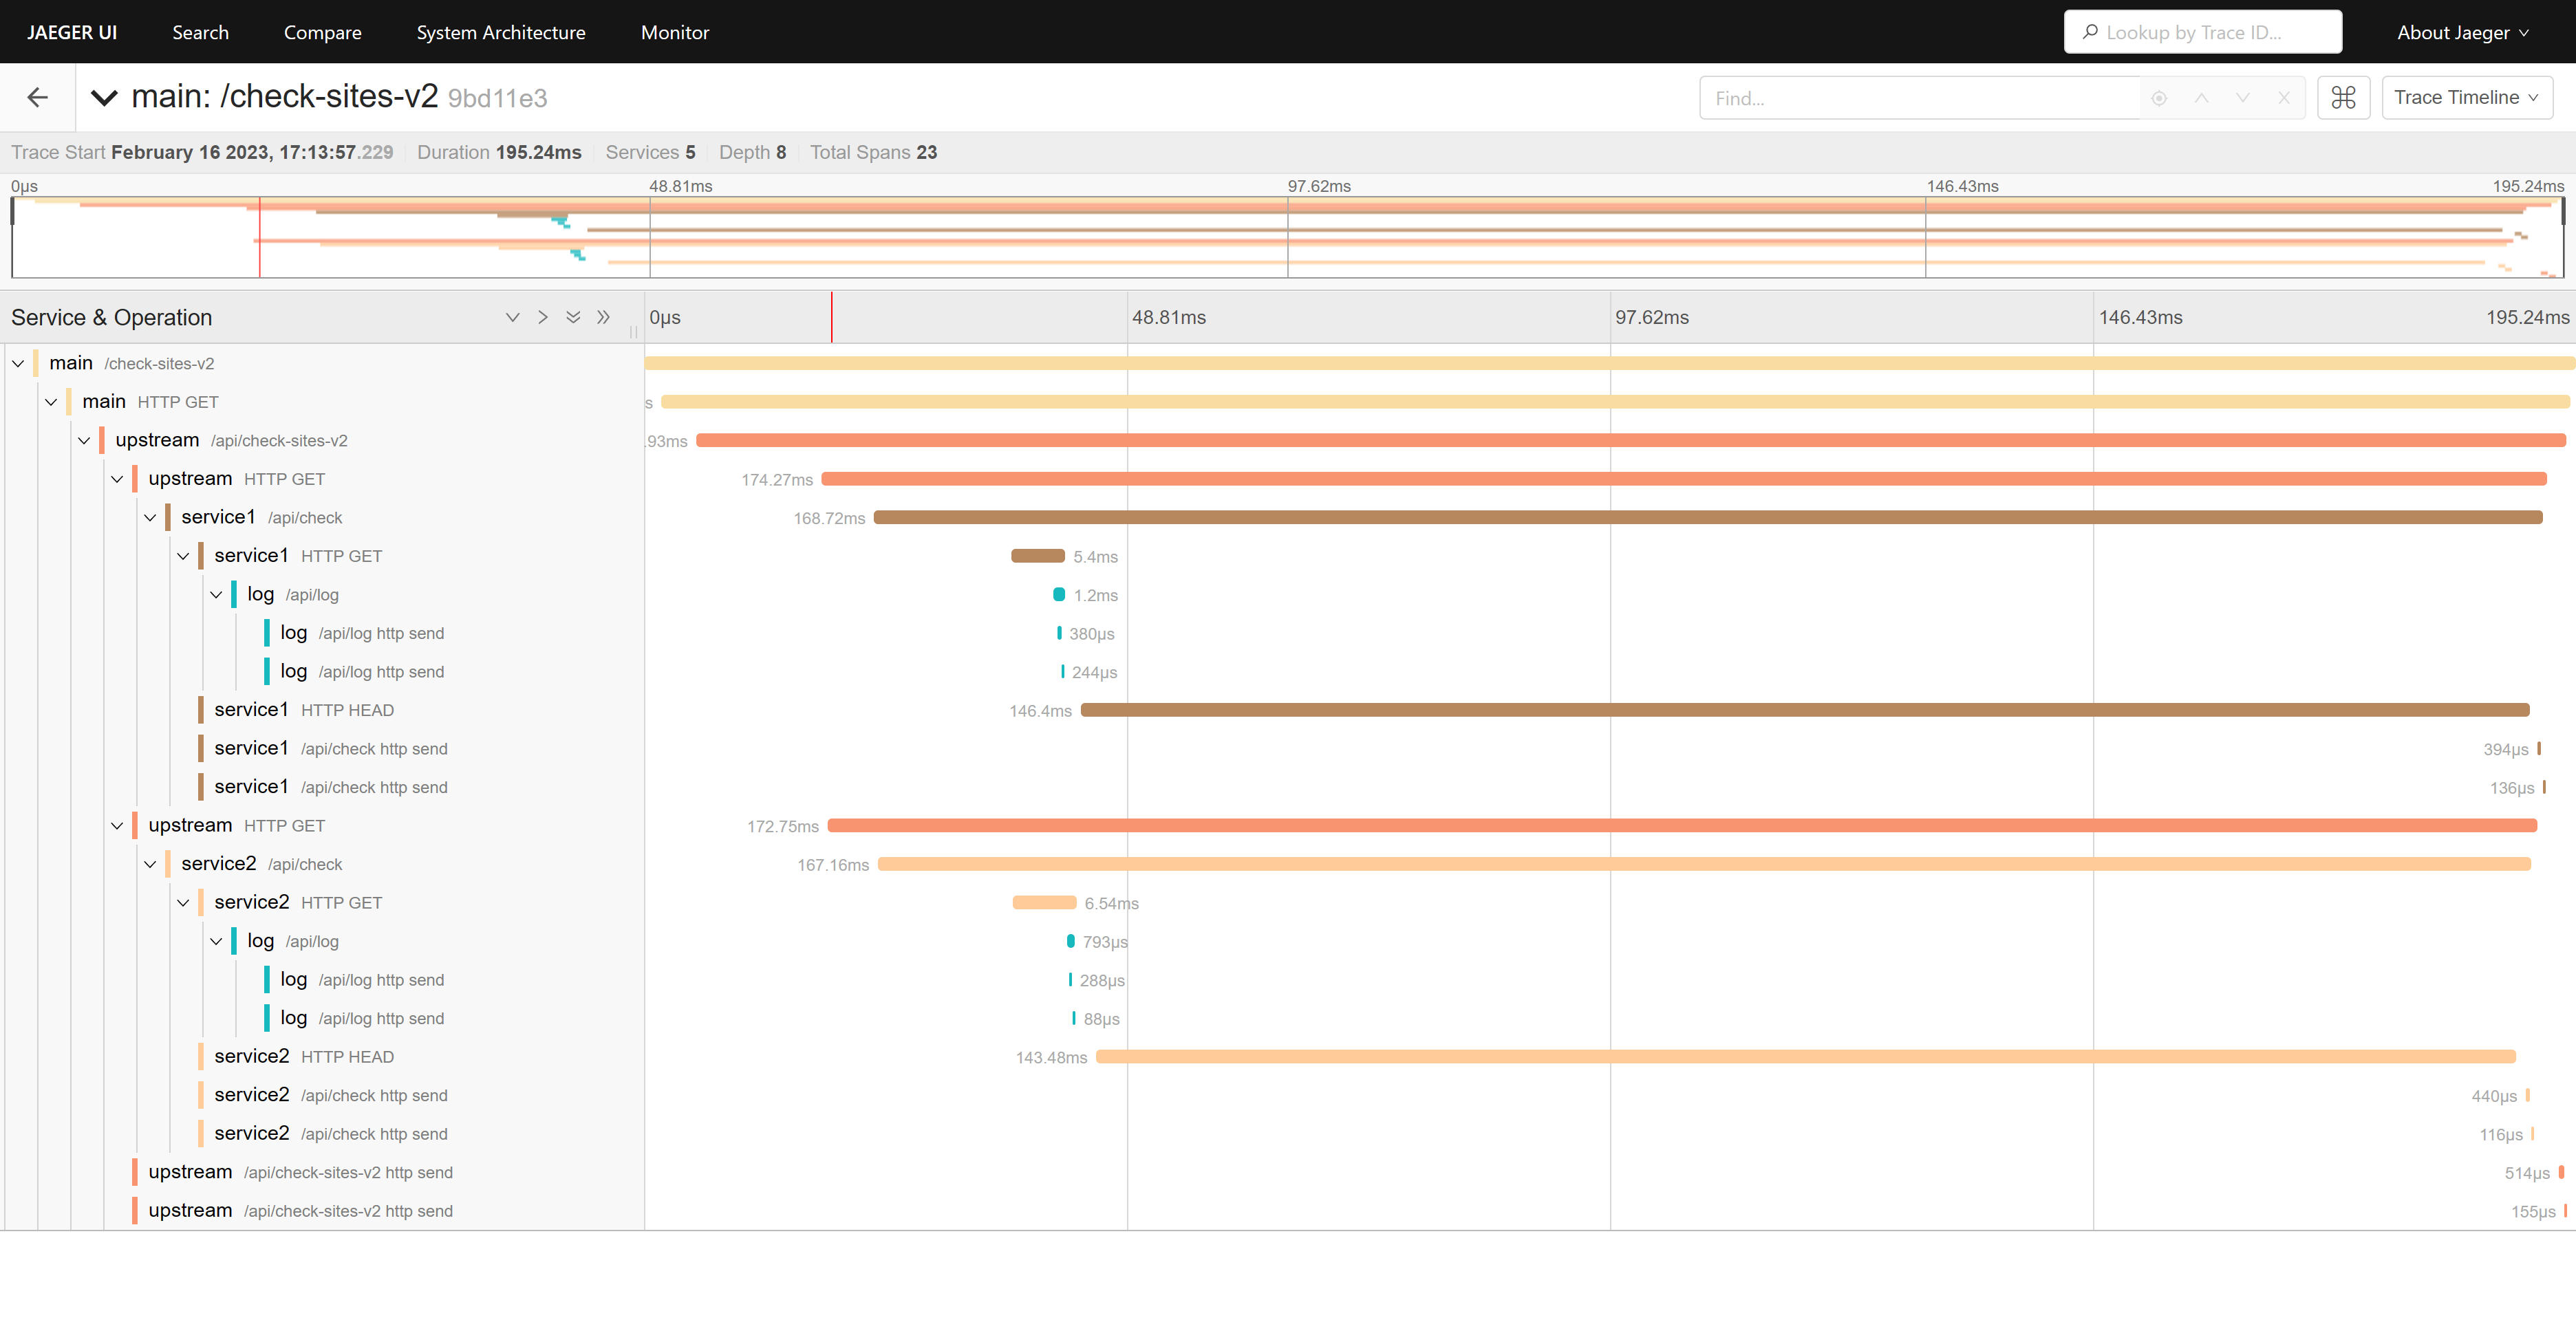
实现一个并行的/api/check-sites-v2接口,可以看到请求时间从 374ms 减少到 195ms,提升十分明显。
可以看看目前的服务间调用关系:
总结
本文介绍了如何使用 opentelemetry 和 jaeger 来实现跨服务链路追踪,以及如何使用 opentelemetry 的自动化追踪功能来实现对异步应用的链路追踪。 在真实的复杂场景中,跨服务链路追踪可以帮助我们快速定位问题,提高服务的可用性和稳定性。
本文参与 腾讯云自媒体同步曝光计划,分享自作者个人站点/博客。
原始发表:2023-02-162,如有侵权请联系 cloudcommunity@tencent.com 删除
评论
登录后参与评论
推荐阅读
目录
腾讯云开发者

Copyright © 2013 - 2026 Tencent Cloud. All Rights Reserved. 腾讯云 版权所有
深圳市腾讯计算机系统有限公司 ICP备案/许可证号:粤B2-20090059 ![]() 粤公网安备44030502008569号
粤公网安备44030502008569号
腾讯云计算(北京)有限责任公司 京ICP证150476号 | 京ICP备11018762号