mapboxGL中山体背景+边界阴影的一种实现方案

mapboxGL中山体背景+边界阴影的一种实现方案
牛老师讲GIS
发布于 2024-05-27 08:24:42
发布于 2024-05-27 08:24:42
概述
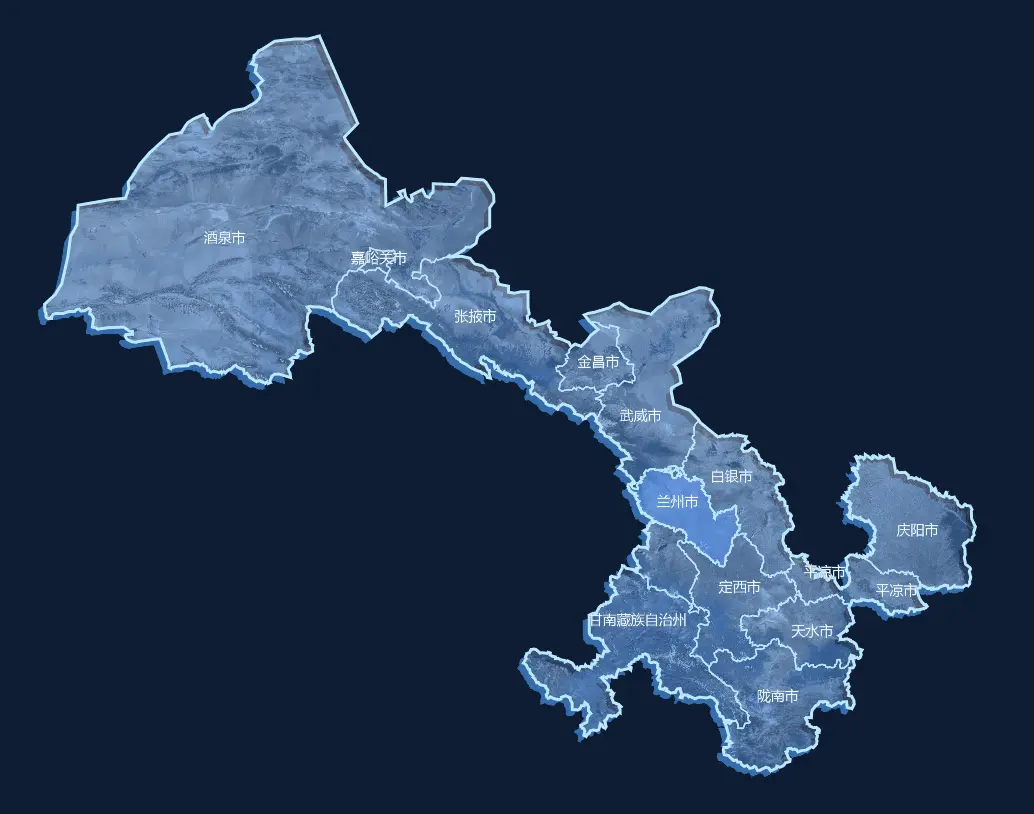
很多地图可视化的项目中有要求实现如下的效果,本文借助QGIS、PS和turf.js,在mapboxGL中实现山体背景+边界阴影的效果。
实现效果
实现
1. 需要数据
要实现这样的效果,我们需要如下数据:
- 山体背景图
- 地级市数据
- 省级边界数据,可通过地级市数据融合得到
- 边界阴影,通过省级边界数据计算获取
测试数据下载地址:https://gitee.com/lzugis15/blogs-demo/blob/master/gansu.zip
2. 数据处理
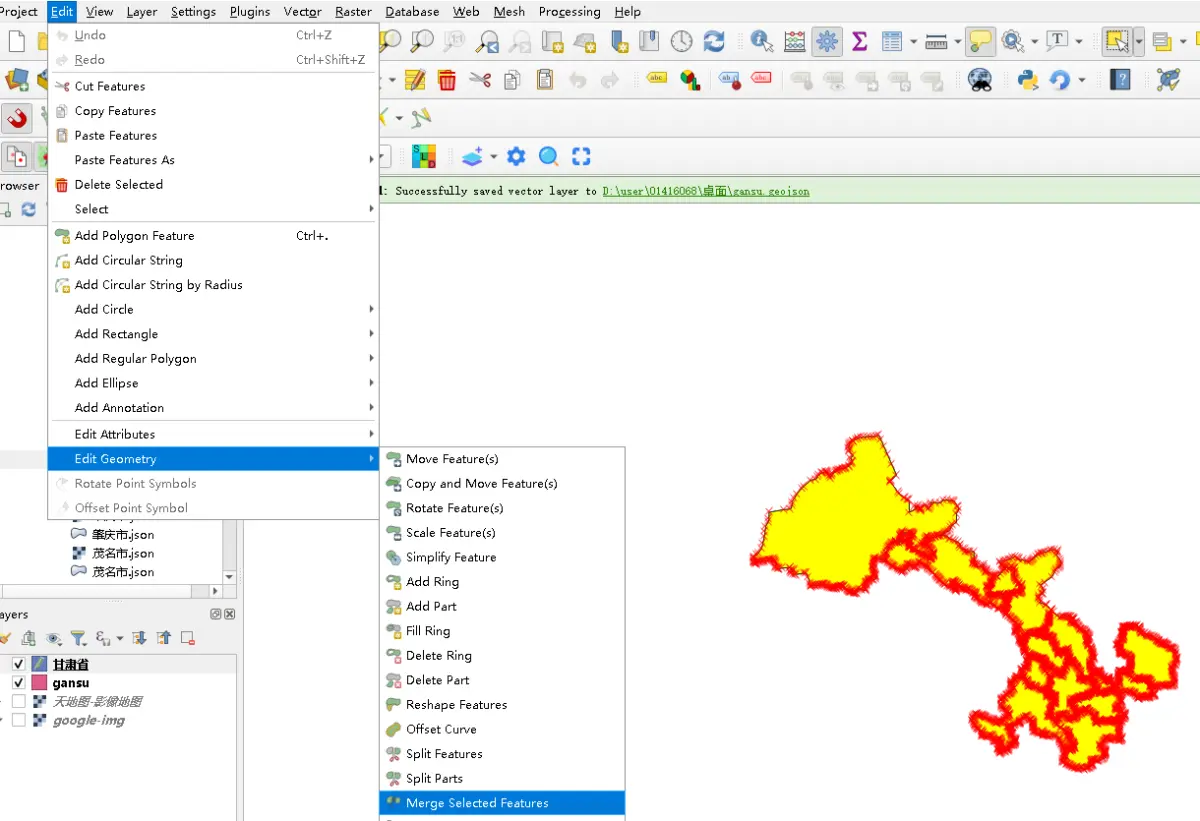
2.1 省级边界数据
如果没有改数据,可复制一份地级市的数据,在QGIS中开启图层编辑,全选要素,通过Merge选中要素生成。
2.2 山体背景图
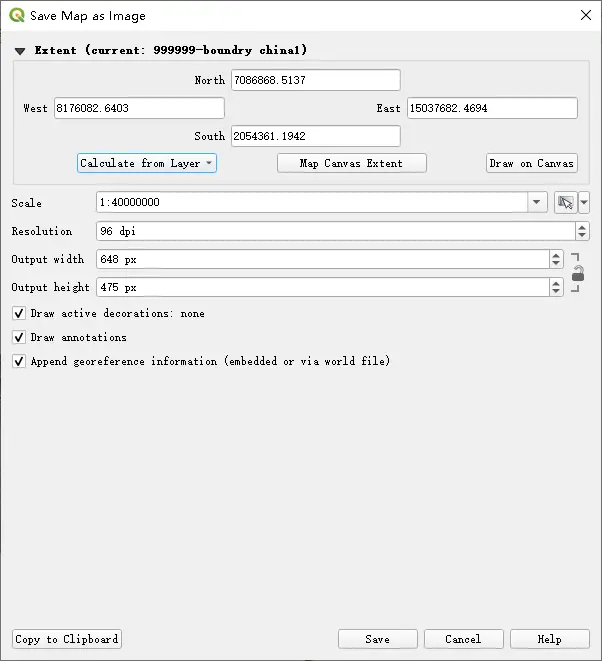
1)导出影像
在QGIS中添加高德影像图,并添加省边界数据,设置省边界不显示,导出地图。
[图片上传中…(image.png-6c9beb-1716705916905-0)]
根据省边界数据计算导出范围,并设置导出格式为*.tif。
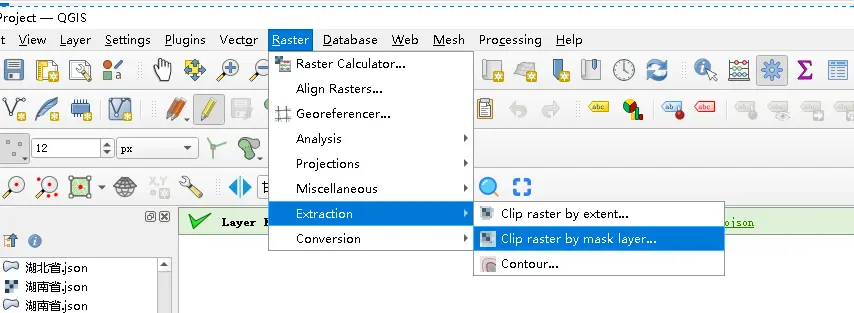
2)裁剪影像
将导出的*.tif添加到QGIS中,在Raster菜单下选择栅格裁剪工具,将导出的数据根据省边界数据进行裁剪。
3)导出背景图
跟操作**1)**一样,导出裁剪后的地图,导出格式选择*.png,导出后的图片如下图。
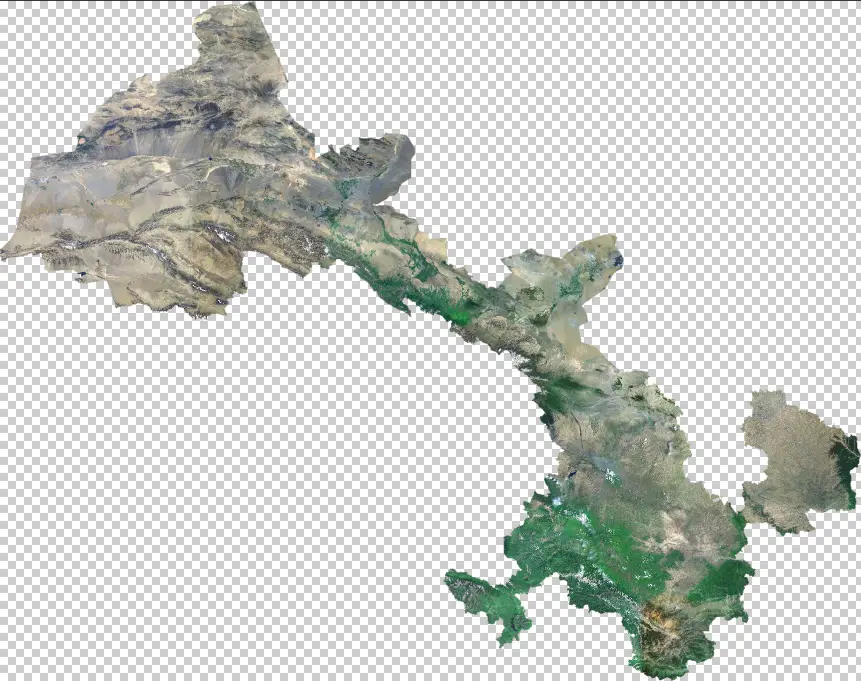
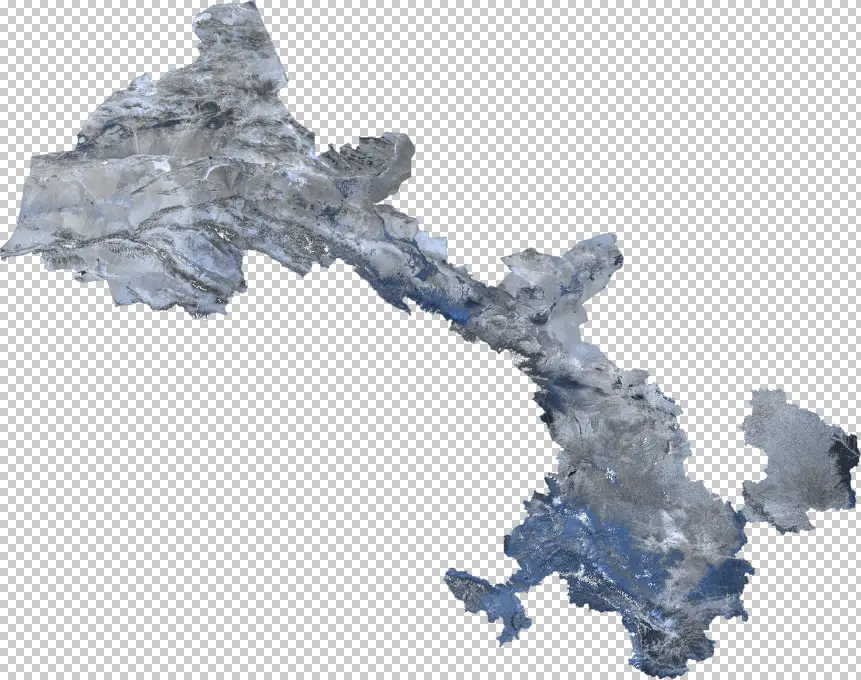
4)处理背景图
导出后的背景图是彩色的,还需要在PS中进一步处理成为蓝色调(可根据需求进行处理)。处理方式是在上面叠加一个图层,设置填充颜色,并设置模式为色相,再将两个图层合并成一个图层,处理后如下图。
2.3 边界阴影
边界阴影效果是将生边界数据进行一定的偏移,这个实现是在代码中实现的,实现代码如下:
const center = this.map.getCenter().toArray();
 // 获取地图中心点屏幕位置
const { x, y } = this.map.project(center);
const offset = [6, 6];
// 计算当前级别下横向、纵向偏移的经纬度
const centerOffset = this.map.unproject([x - offset[0], y - offset[1]]).toArray();
const xOffset = centerOffset[0] - center[0],
  yOffset = center[1] - centerOffset[1];
// 深拷贝,防止数据被篡改
const _res = JSON.parse(JSON.stringify(result));
const geometry = _res.geometry;
if (geometry.type === "polygon") {
  geometry.coordinates.forEach((c) => {
    c.forEach((p) => {
      p[0] += xOffset;
      p[1] += yOffset;
    });
  });
} else {
  geometry.coordinates.forEach((c) => {
    c.forEach((p) => {
      p.forEach((_p) => {
        _p[0] += xOffset;
        _p[1] += yOffset;
      });
    });
  });
}
3. 完整实现
完整实现代码如下。
<template>
  <div class="map">
    <my-map
      :onLoad="mapLoaded"
      :style="style"
      :center="[104.29901000000001, 37.94116735562514]"
      :zoom="zoom"
    >
    </my-map>
  </div>
</template>

<script>
import { MyMap } from "@/components/map/index.vue";
import * as turf from "@turf/turf";

class Geojson {
  constructor(features = []) {
    this.features = features;
    this.type = "FeatureCollection";
  }
}

export default {
  components: {
    MyMap,
  },
  data() {
    return {
      map: null,
      zoom: 3.51,
      style: {
        version: 8,
        name: "my-map-style",
        sprite: window.location.href + "icons/sprite",
        glyphs: window.location.href + "fonts/{fontstack}/{range}.pbf",
        sources: {
          "image-admin": {
            url: "/imgs/gansu-bg.png",
            type: "image",
            // 省边界数据的四至
            coordinates: [
              [92.3390100000000018, 42.795259999999999],
              [108.712530000000001, 42.795259999999999],
              [108.712530000000001, 32.5938900000000018],
              [92.3390100000000018, 32.5938900000000018],
            ],
          },
          "admin-boundry": {
            type: "geojson",
            data: new Geojson(),
          },
          "admin-shadow": {
            type: "geojson",
            data: new Geojson(),
          },
          "admin-children-boundry": {
            type: "geojson",
            data: new Geojson(),
          },
          "admin-children-boundry-h": {
            type: "geojson",
            data: new Geojson(),
          },
        },
        layers: [
          {
            id: "admin-shadow-fill",
            source: "admin-shadow",
            type: "fill",
            paint: {
              "fill-color": "#356caa",
              "fill-opacity": 1,
            },
          },
          {
            id: "image-admin",
            source: "image-admin",
            type: "raster",
            paint: {
              "raster-opacity": 0.55,
              "raster-fade-duration": 0,
            },
          },
          {
            id: "admin-children-boundry-fill",
            source: "admin-children-boundry",
            type: "fill",
            paint: {
              "fill-color": "#599AFF",
              "fill-opacity": 0.1,
            },
          },
          {
            id: "admin-children-boundry-fill-h",
            source: "admin-children-boundry-h",
            type: "fill",
            paint: {
              "fill-color": "#599AFF",
              "fill-opacity": 0.5,
            },
          },
          {
            id: "admin-children-boundry-line",
            source: "admin-children-boundry",
            type: "line",
            paint: {
              "line-color": "#bbe6ff",
              "line-width": 1.5,
            },
          },
          {
            id: "admin-children-boundry-line-h",
            source: "admin-children-boundry-h",
            type: "line",
            paint: {
              "line-color": "#bbe6ff",
              "line-width": 2,
            },
          },
          {
            id: "admin-boundry-line",
            source: "admin-boundry",
            type: "line",
            paint: {
              "line-color": "#bbe8ff",
              "line-width": 3,
            },
          },
          {
            id: "admin-children-boundry-label",
            source: "admin-children-boundry",
            type: "symbol",
            layout: {
              'text-allow-overlap': false,
              'text-size': 14,
              'text-rotate': 0,
              'text-field': `{name}`,
            },
            paint: {
              'text-opacity': 1,
              'text-color': '#ffffff',
              'text-halo-blur': 0.1,
              'text-halo-width': 0.1,
              'text-halo-color': '#356caa',
            },
          },
        ],
      },
      adminFeatures: [],
    };
  },
  methods: {
    setBoundry(features) {
      features = JSON.parse(JSON.stringify(features));
      let result = features.splice(0, 1)[0],
        feat2 = features.splice(0, 1)[0];
      while (features.length > 0) {
        result = turf.union(result, feat2);
        feat2 = features.splice(0, 1)[0];
      }
      this.map.getSource("admin-boundry").setData(result);
      setTimeout(() => {
        const center = this.map.getCenter().toArray();
        const { x, y } = this.map.project(center);
        const offset = [6, 6];
        const centerOffset = this.map
          .unproject([x - offset[0], y - offset[1]])
          .toArray();
        const xOffset = centerOffset[0] - center[0],
          yOffset = center[1] - centerOffset[1];
        const _res = JSON.parse(JSON.stringify(result));
        const geometry = _res.geometry;
        if (geometry.type === "polygon") {
          geometry.coordinates.forEach((c) => {
            c.forEach((p) => {
              p[0] += xOffset;
              p[1] += yOffset;
            });
          });
        } else {
          geometry.coordinates.forEach((c) => {
            c.forEach((p) => {
              p.forEach((_p) => {
                _p[0] += xOffset;
                _p[1] += yOffset;
              });
            });
          });
        }
        this.map.getSource("admin-shadow").setData(_res);
      }, 200);
    },

    registerEvent() {
      this.map.on("mousemove", "admin-children-boundry-fill", (e) => {
        const adcode = e.features[0].properties.adcode;
        const feature = this.adminFeatures.find(
          (d) => d.properties.adcode === adcode
        );
        this.map.getSource("admin-children-boundry-h").setData(feature);
        this.map.getCanvasContainer().style.cursor = "pointer";
      });
      this.map.on("mouseout", "admin-children-boundry-fill", (e) => {
        this.map.getSource("admin-children-boundry-h").setData(new Geojson());
        this.map.getCanvasContainer().style.cursor = "default";
      });
    },
    initData() {
      this.map.scrollZoom.disable();
      this.map.doubleClickZoom.disable();
      this.map.dragPan.disable();
      this.map.dragRotate.disable();

      fetch(`/gansu-b.geojson`)
        .then((res) => res.json())
        .then((geojson) => {
          this.setBoundry(geojson.features);
          this.fit2Geojson(geojson);
        });
      fetch(`/gansu-c.geojson`)
        .then((res) => res.json())
        .then((geojson) => {
          this.adminFeatures = geojson.features;
          this.map.getSource("admin-children-boundry").setData(geojson);
          this.registerEvent()
        });
    },
    mapLoaded(map) {
      this.map = map;
      this.initData();
    },
    fit2Geojson(geojson) {
      const [xmin, ymin, xmax, ymax] = turf.bbox(geojson);
      const bbox = [
        [xmin, ymin],
        [xmax, ymax],
      ];
      const padding = 100;
      const options = {
        padding: {
          top: padding,
          bottom: padding,
          left: padding,
          right: padding,
        },
        duration: 100,
      };
      this.map.fitBounds(bbox, options);
    },
  },
};
</script>

<style scoped lang="scss">
.map {
  width: 100%;
  height: 100%;
}
</style>
本文参与 腾讯云自媒体同步曝光计划,分享自作者个人站点/博客。
原始发表:2024-05-26,如有侵权请联系 cloudcommunity@tencent.com 删除
评论
登录后参与评论
推荐阅读
目录
腾讯云开发者

Copyright © 2013 - 2026 Tencent Cloud. All Rights Reserved. 腾讯云 版权所有
深圳市腾讯计算机系统有限公司 ICP备案/许可证号:粤B2-20090059 ![]() 粤公网安备44030502008569号
粤公网安备44030502008569号
腾讯云计算(北京)有限责任公司 京ICP证150476号 | 京ICP备11018762号