单细胞转录组 | 细胞互作分析


细胞互作介绍
细胞互作(Cell-cell interaction)指的是不同细胞类型之间通过配体-受体对进行的信号交流过程。在复杂的组织和器官中,细胞间的通讯网络对于维持组织功能、调节生理过程以及疾病的发生发展具有重要作用。通过单细胞测序技术,可以在单细胞分辨率上推断这些细胞间的通讯模式。
为什么要研究细胞互作?
- 揭示组织微环境复杂性:了解不同细胞类型如何相互影响和调节
- 探索疾病发生机制:病理状态下细胞通讯网络的改变可能是疾病的关键机制
- 药物靶点开发:识别关键的细胞通讯路径可为靶向治疗提供新思路
- 发育过程研究:细胞分化和组织形成依赖于精确的细胞间通讯
细胞互作分析的工具和方法
目前常用的细胞互作分析工具包括CellChat、CellPhoneDB、NicheNet等。这些工具基于已知的配体-受体数据库,通过统计方法推断细胞间的通讯模式。在本文中,我将使用CellChat进行分析,这是一个基于R语言的强大工具,能够定量推断细胞间通讯网络并进行多种可视化。
基于R的细胞互作分析实践
1. 环境准备和数据导入
首先,需要安装并加载必要的R包:
# 安装CellChat包(如果尚未安装)
if (!requireNamespace("remotes", quietly = TRUE))
    install.packages("remotes")
remotes::install_github("sqjin/CellChat")

# 加载必要的包
library(Seurat)
library(igraph)
library(Matrix)
library(ggplot2)
library(dplyr)
library(patchwork)
library(CellChat)

# 导入已处理好的Seurat对象
seurat_obj <- readRDS("path/to/your/seurat_object.rds")

# 查看细胞类型注释
table(seurat_obj$seurat_annotations)
2.准备CellChat分析所需的数据
CellChat需要表达矩阵和细胞元信息作为输入,我们从Seurat对象中提取:
# 提取表达数据(使用normalized data)
data <- GetAssayData(seurat_obj, assay = "RNA", slot = "data")

# 提取细胞元信息(确保包含seurat_annotations[celltype]列)
meta <- seurat_obj@meta.data

# 创建CellChat对象
cellchat <- createCellChat(object = data, meta = meta, group.by = "seurat_annotations")

# 设置使用的物种(人类或小鼠)
cellchat@DB <- CellChatDB.human  # 如果是人类样本
# cellchat@DB <- CellChatDB.mouse  # 如果是小鼠样本
3. 预处理和细胞互作分析
# 预处理表达数据
cellchat <- subsetData(cellchat)  # 只保留配体受体数据库中的基因
cellchat <- identifyOverExpressedGenes(cellchat)
cellchat <- identifyOverExpressedInteractions(cellchat)

# 计算细胞间通讯概率
cellchat <- computeCommunProb(cellchat)

# 推断细胞通讯网络
cellchat <- computeCommunProbPathway(cellchat)

# 计算聚合的细胞通讯网络
cellchat <- aggregateNet(cellchat)
步骤解释:
● subsetData:筛选出在数据库中作为配体或受体的基因
● identifyOverExpressedGenes:识别每个细胞群中过表达的基因
● identifyOverExpressedInteractions:基于过表达基因识别可能的配体-受体对
● computeCommunProb:计算每对细胞群之间的通讯概率
● computeCommunProbPathway:在信号通路水平上计算通讯概率
● aggregateNet:汇总所有细胞群间的通讯强度
tips:在计算细胞间通讯概率的时候,报错有未使用的因子

但是我查看细胞身份,发现所有因子水平在数据中都有对应的细胞,似乎不存在“未使用的水平”(unused levels)

最后找到原因是metaseurat_annotations 存在NA值。上面在创建 cellchat 对象时,idents 是基于 metaseurat_annotations(cell_type)设置的。如果 meta

# 移除 NA
meta <- meta[!is.na(meta$seurat_annotations), ]
data <- data[, rownames(meta)]
4.可视化细胞互作网络
# 查看所有细胞类型间的通讯网络强度
groupSize <- as.numeric(table(cellchat@idents))
par(mfrow = c(1,2), xpd=TRUE)
netVisual_circle(cellchat@net$count, vertex.weight = groupSize, weight.scale = T, label.edge= F, title.name = "Number of interactions")
netVisual_circle(cellchat@net$weight, vertex.weight = groupSize, weight.scale = T, label.edge= F, title.name = "Interaction weights/strength")
在这部分:
● netVisual_circle:创建圆形图展示细胞间通讯的数量和强度
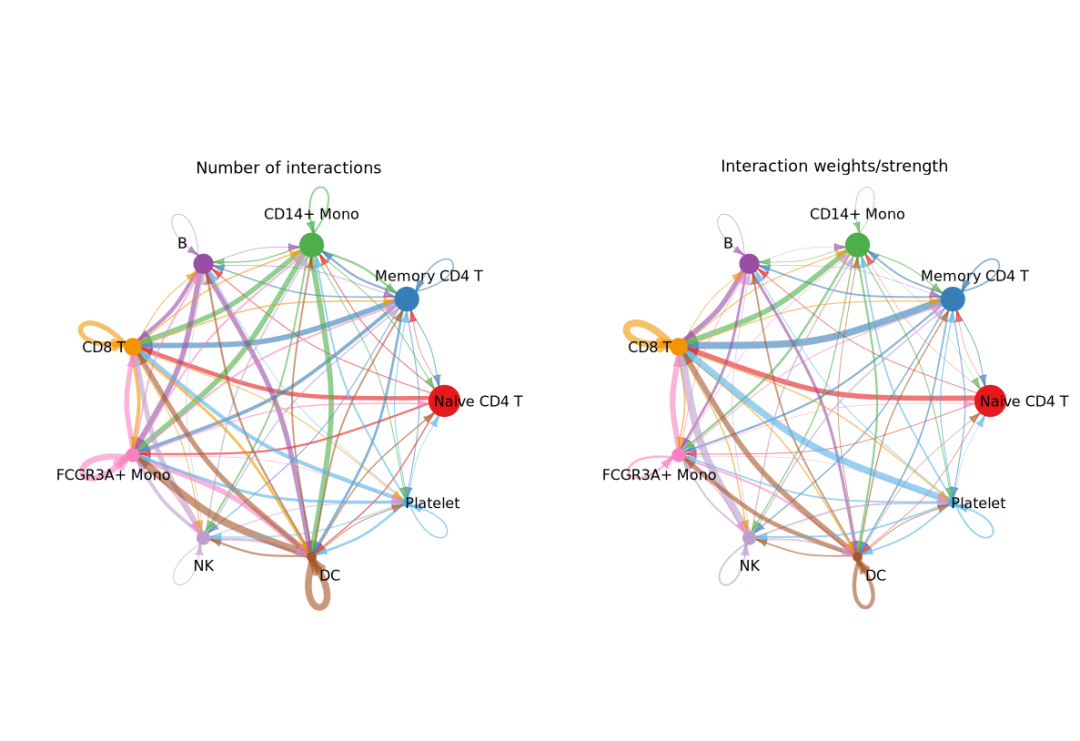
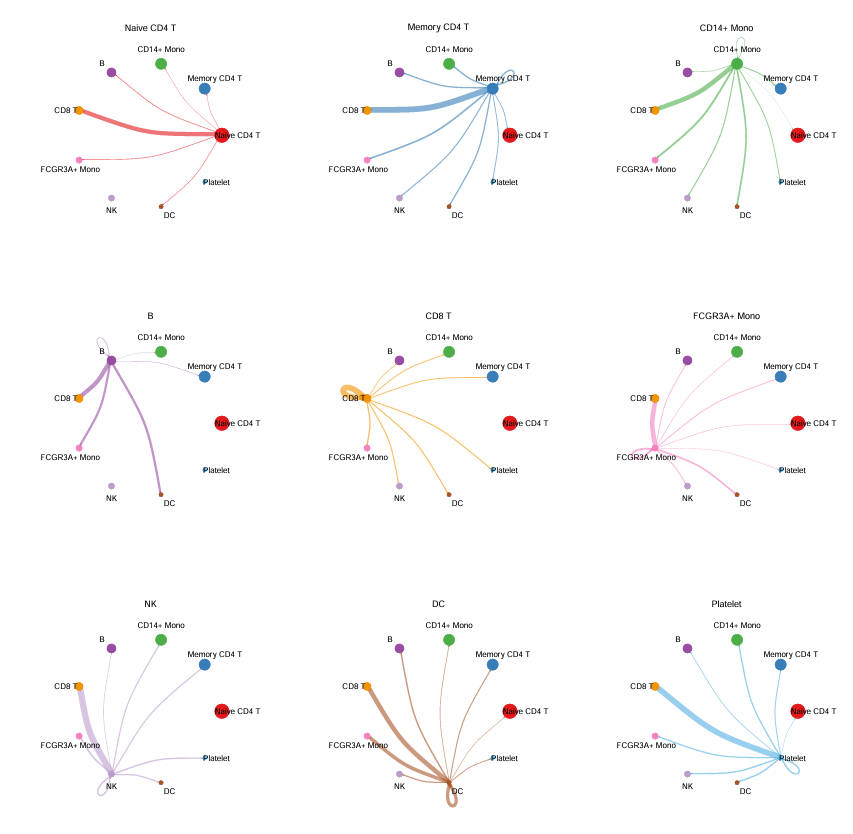
为每种细胞类型绘制其发出的信号强度(基于 cellchat@net$weight)
# 保存到 PDF 文件
pdf("cellchat_weight_plots.pdf", width = 12, height = 12)
par(mfrow = c(3,3), xpd = TRUE)
mat <- cellchat@net$weight
for (i in 1:nrow(mat)) {
  mat2 <- matrix(0, nrow = nrow(mat), ncol = ncol(mat), dimnames = dimnames(mat))
  mat2[i, ] <- mat[i, ]
  netVisual_circle(mat2, vertex.weight = groupSize, weight.scale = TRUE, arrow.width = 0.2,
                   arrow.size = 0.1, edge.weight.max = max(mat), title.name = rownames(mat)[i])
}
dev.off()
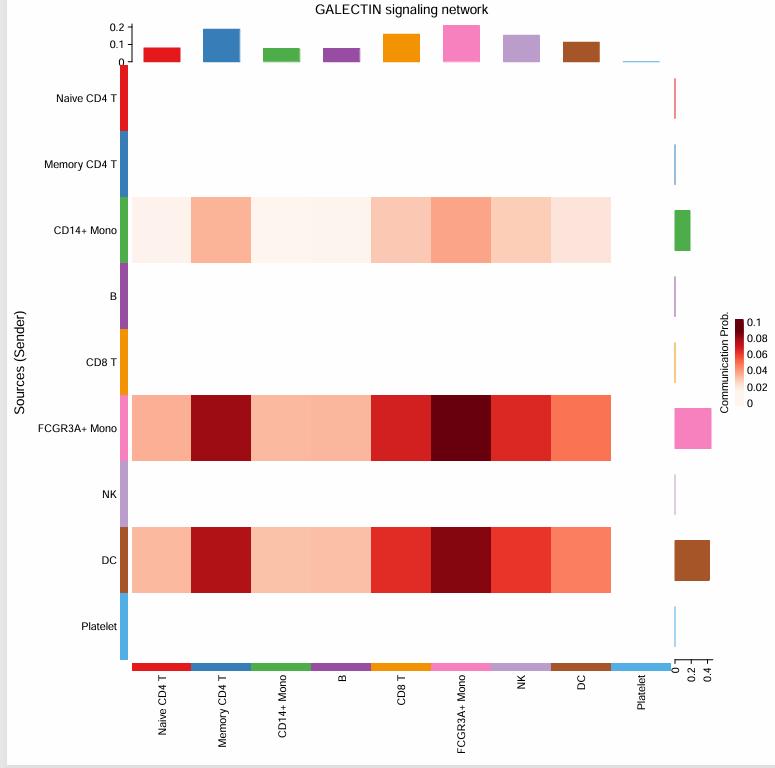
#查看都有哪些信号通路
cellchat@netP$pathways
# 选择其中一个信号通路,比如说GALECTIN
pathways.show <- c("GALECTIN")
#绘制热图
pdf("heatmap_GALECTIN.pdf", width = 8, height = 8)
netVisual_heatmap(cellchat, signaling = pathways.show, color.heatmap = "Reds")
dev.off()
#也可以通过直接指定的方式
pdf("heatmap_valid_pathways.pdf", width = 8, height = 8)
netVisual_heatmap(cellchat, signaling =  "MHC-II", color.heatmap = "Reds")
dev.off()
配体-受体层级的可视化
##计算配体受体对选定信号通路的贡献值(在这里就是查看哪条信号通路对MHC-II贡献最大)
pdf("barmap_valid_pathways.pdf", width = 8, height = 8)
netAnalysis_contribution(cellchat, signaling = "MHC-II")
dev.off()
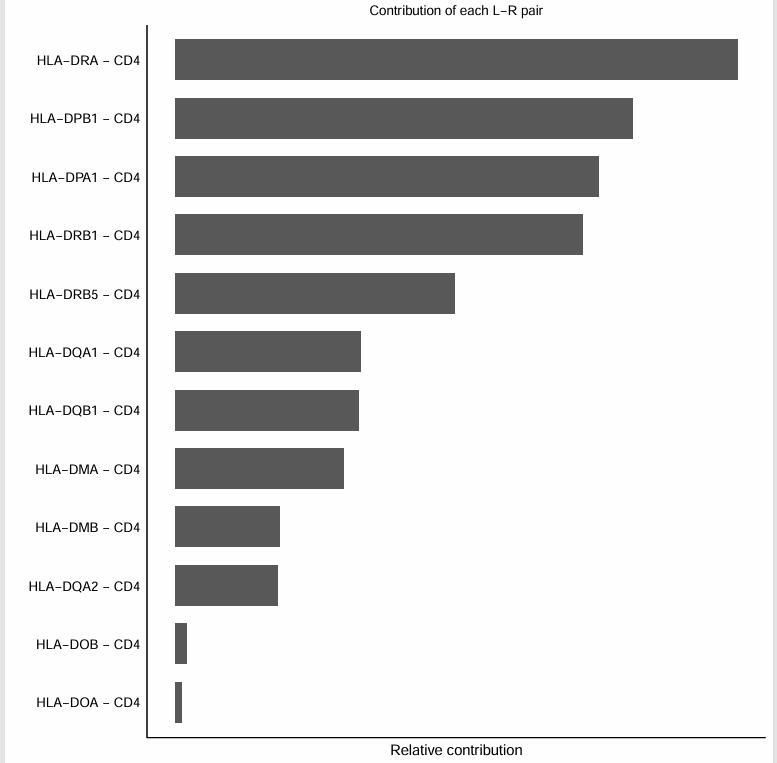
从图中就可以看出HLA − DRA − CD4这条信号通路对MHC-II贡献最大。
5. 社会网络分析
通过计算每个细胞群的网络中心性指标,识别每类细胞在信号通路中的角色/作用C(发送者、接收者、调解者和影响者)
# 分析细胞群的发送和接收能力
pdf("heatmap_Role_pathways.pdf", width = 8, height = 8)
cellchat <- netAnalysis_computeCentrality(cellchat, slot.name = "netP")
netAnalysis_signalingRole_network(cellchat, signaling = pathways.show,
                                  width = 15, height = 6, font.size = 10)
dev.off()
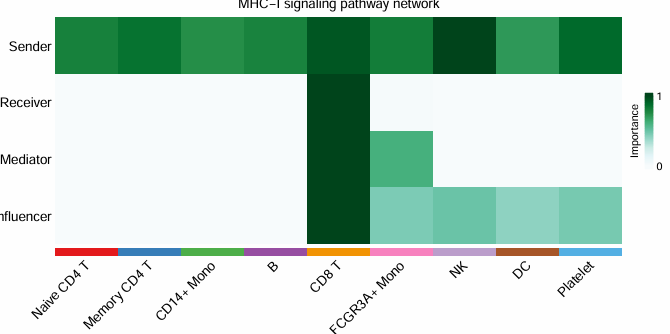
这里每类细胞都会生成一个热图,篇幅有限,我只放一个示例。
总结
完成细胞互作分析后,需要关注以下几点:
- 识别主要的信号通路和关键的配体-受体对
- 分析不同细胞群的通讯模式和功能角色
- 结合生物学背景解释发现的通讯网络
- 如有对照组,可以使用CellChat的compareInteractions等函数进行比较分析
通过这些分析,我们可以全面了解组织中的细胞通讯网络,为进一步的功能验证和机制研究提供方向。
本文参与 腾讯云自媒体同步曝光计划,分享自微信公众号。
原始发表:2025-03-13,如有侵权请联系 cloudcommunity@tencent.com 删除
目录
腾讯云开发者

Copyright © 2013 - 2026 Tencent Cloud. All Rights Reserved. 腾讯云 版权所有
深圳市腾讯计算机系统有限公司 ICP备案/许可证号:粤B2-20090059  粤公网安备44030502008569号
腾讯云计算(北京)有限责任公司 京ICP证150476号 | 京ICP备11018762号