🤩 granulator | 快速运行多种反卷积方法计算细胞比例!~

🤩 granulator | 快速运行多种反卷积方法计算细胞比例!~

生信漫卷
发布于 2025-07-27 12:29:48
发布于 2025-07-27 12:29:48
写在前面
昨天去骑车,真的是太热了!~🥵
体力远不如前了,爬坡累成狗!~🐶
用到的包
rm(list = ls())
# if (!requireNamespace("BiocManager", quietly = TRUE))
#     install.packages("BiocManager")
# BiocManager::install("granulator")

library(granulator)
示例数据
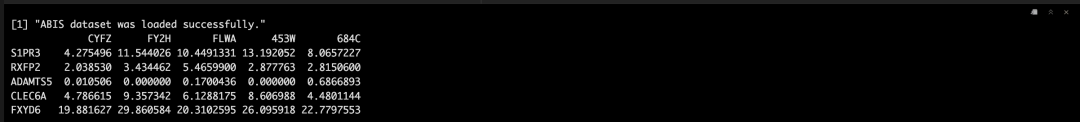
bulk data!~
load_ABIS()

bulkRNAseq_ABIS[1:5, 1:5]
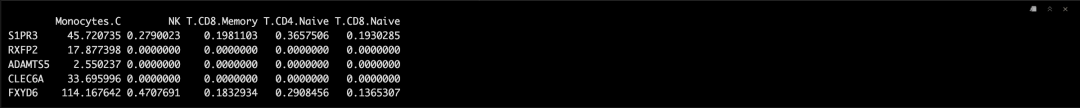
Reference profiles!~
sigMatrix_ABIS_S0[1:5, 1:5]
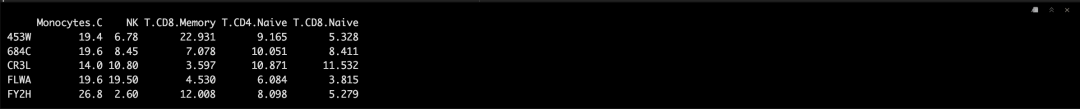
真实细胞比例!~
作为真实结果进行比较!~😘
groundTruth_ABIS[1:5, 1:5]
Workflow
整个流程包括:👇
1️⃣ Reference profiles;
2️⃣ Deconvolution;
3️⃣ Benchmarking;
4️⃣ Correlation.
比较多个reference profiles
这里我们使用多个比较多个reference,比较一下结果。😏
# create list if multiple signature matrices to test simultaneously
sigList = list(
  ABIS_S0 = sigMatrix_ABIS_S0,
  ABIS_S1 = sigMatrix_ABIS_S1,
  ABIS_S2 = sigMatrix_ABIS_S2,
  ABIS_S3 = sigMatrix_ABIS_S3)
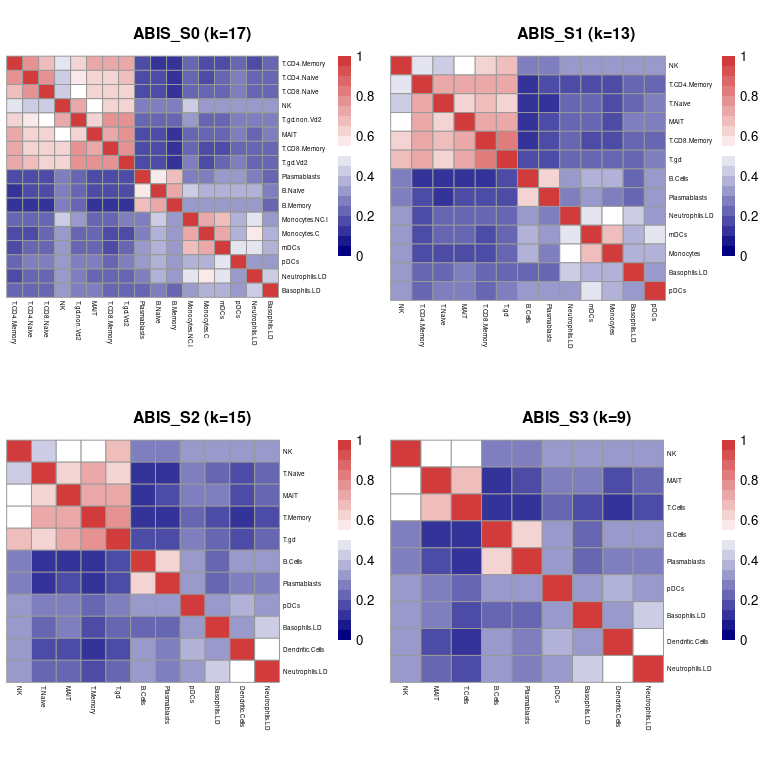
我们通过使用plot_similarity()计算它们的Kendall Rank相关系数来绘制所有参考谱的细胞类型相似性矩阵.
# plot signature matrix similarity matrices
plot_similarity(sigMatrix=sigList)
对bulk数据进行反卷积
# deconvolute input data using all available methods by default
decon <- deconvolute(m = bulkRNAseq_ABIS, sigMatrix = sigList)
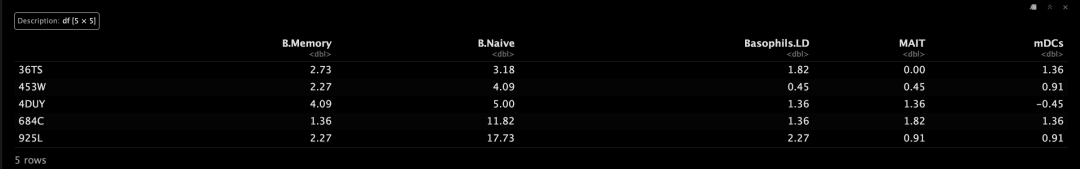
看一下ABIS_S0的反卷积结果!~
# print cell type proportions for svr model on ABIS_S0 reference profile
decon$proportions$svr_ABIS_S0[1:5, 1:5]
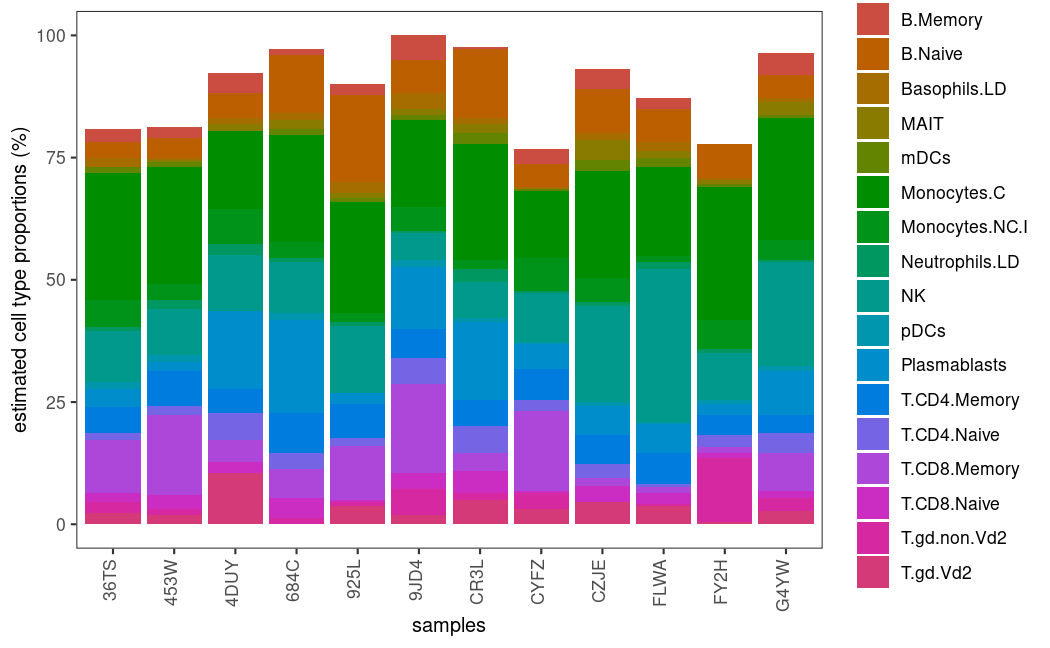
可视化!~
# plot cell type proportions for svr model on ABIS_S0 reference profile
plot_proportions(deconvoluted = decon, method = 'svr', signature = 'ABIS_S0')
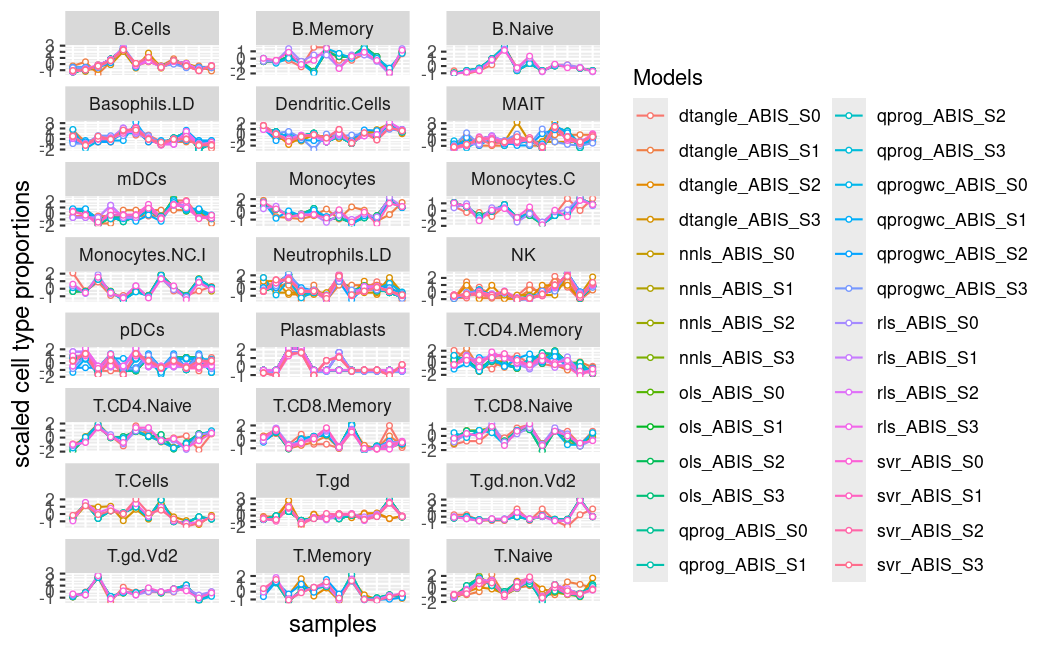
为了绘制所有估计的细胞类型比例,我们使用函数plot_deconvolute(), 可以比较反卷积方法和细胞类型的结果。
# plot cell type proportions
plot_deconvolute(deconvoluted = decon, scale = TRUE, labels = FALSE)
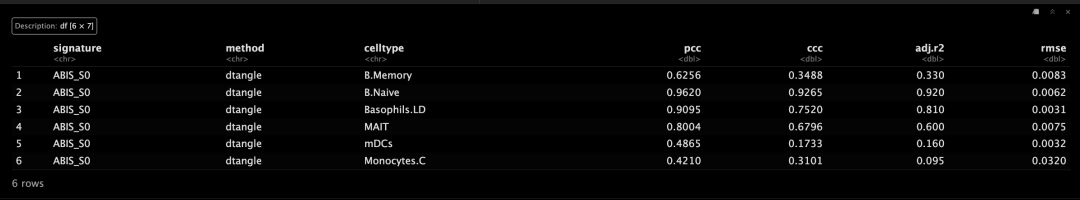
反卷积方法的Benchmarking
# benchmark methods by correlating estimated to measured cell type proportions
bench <- benchmark(deconvoluted = decon, ground_truth = groundTruth_ABIS)
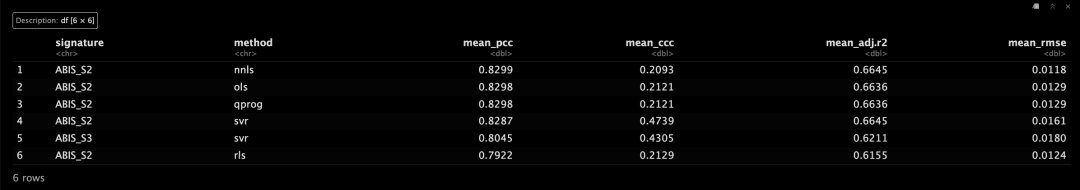
# print metrics
head(bench$summary)
# print metrics
head(bench$rank)
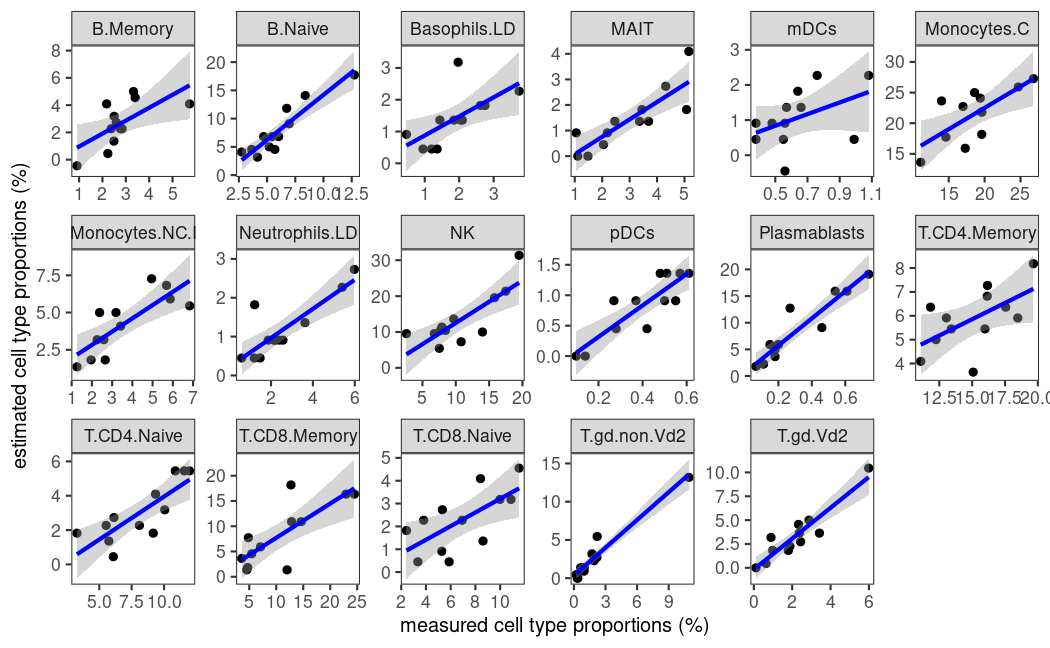
估计细胞类型比例与测量细胞类型比例的线性回归可以在benchmark()结果上使用plot_regress()可视化。😜
在这里,我们使用sigMatrix_ABIS_S0参考文件分析svr模型在反卷积上的性能。🙊
# plot regression for svr model on ABIS_S0 reference profile
plot_regress(benchmarked = bench, method = 'svr', signature = 'ABIS_S0')
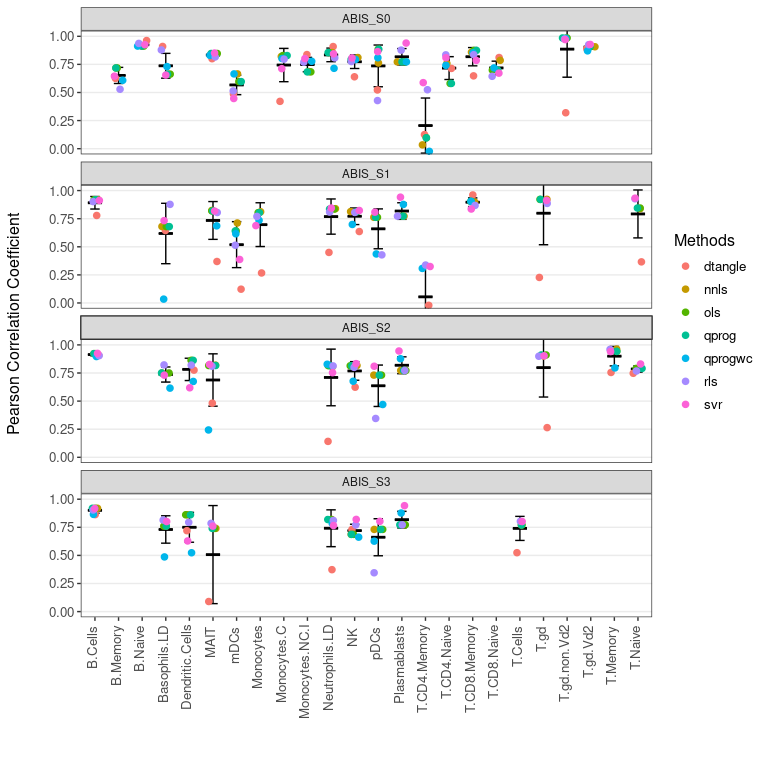
使用函数plot_benchmark()可视化所有方法的汇总统计量。👀
# plot pearson correlation between predictions and true proportions
plot_benchmark(benchmarked = bench, metric = 'pcc')
反卷积比例的相关性分析
# deconvolute input data using selected methods and reference profile matrix
methods <- c('ols','nnls','qprog','rls','svr')
decon <- deconvolute(bulkRNAseq_ABIS, list(ABIS_S2 = sigMatrix_ABIS_S2), methods)
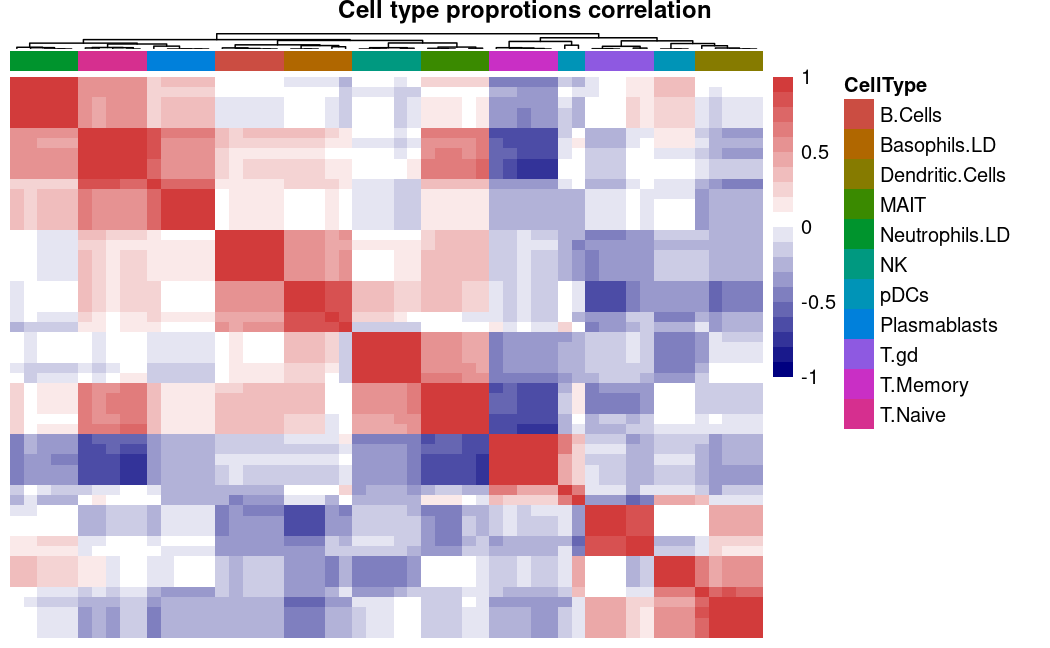
当没有真实数据参考时,我们可以通过使用correlate()函数计算所有方法生成的估计细胞类型比例之间的相关性来评估不同反卷积方法的性能。😀
这里可以看到所有方法之间估计的细胞类型比例高度相关,表明反卷积方法在估计结果上基本一致。😏
# correlation analysis
correl <- correlate(deconvoluted = decon)

# correlation heatmap
plot_correlate(correlated = correl, method="heatmap", legend=TRUE)
# correlation mean summary statistics
head(correl$summary)
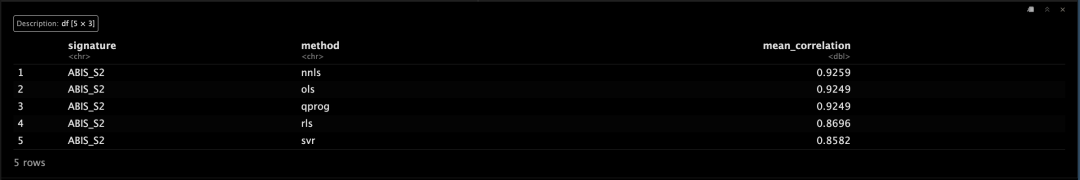
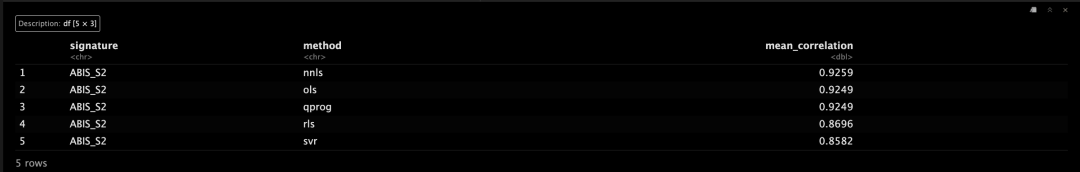
# deconvolution method ranking
head(correl$rank)
本文参与 腾讯云自媒体同步曝光计划,分享自微信公众号。
原始发表:2025-07-26,如有侵权请联系 cloudcommunity@tencent.com 删除
评论
登录后参与评论
推荐阅读
目录
腾讯云开发者

Copyright © 2013 - 2026 Tencent Cloud. All Rights Reserved. 腾讯云 版权所有
深圳市腾讯计算机系统有限公司 ICP备案/许可证号:粤B2-20090059 ![]() 粤公网安备44030502008569号
粤公网安备44030502008569号
腾讯云计算(北京)有限责任公司 京ICP证150476号 | 京ICP备11018762号