简介
TI-Profiler 是专为 PyTorch 分布式训练设计的性能分析工具,支持 CUDA、NVTX 和 NCCL 性能追踪。用户无需修改训练代码,即可对 PyTorch 训练任务进行全面的性能分析。
核心功能
无代码侵入:无需修改训练代码,通过命令行包装器即可启用性能分析。
多分析器支持:支持 PyTorch Profiler 和 Nsight Systems 两种分析工具。
分布式训练支持:支持多 GPU、多节点的分布式训练场景。
灵活的分析范围:支持按训练步骤(steps)或时间范围(durations)进行分析。
云存储集成:支持将分析结果直接上传到腾讯云 COS。
多框架兼容:兼容 PyTorch、DeepSpeed、Horovod、ColossalAI 等主流训练框架
使用限制
当前工具仅支持 PyTorch 框架的训练任务
系统依赖如下:
Python3.8 或更高版本
CUDA11.0 或更高版本
PyTorch2.0 或更高版本
操作步骤
安装方式
使用 pip 安装
pip install tiprofiler
快速开始
1. 分析特定训练步骤
分析训练第5-10步:
tiprof --steps 5-10 --nsys python train.py
2. 按时间范围分析
分析训练开始后30-40秒:
tiprof --durations 30-40 python train.py
查看分析结果
tiprof 会生成多种类型的性能分析文件,具体取决于使用的分析器和配置。
输出文件类型
1. PyTorch Profiler 结果(默认)
文件格式:TensorBoard 格式(.pt.trace.json)
位置:
<output_dir>/<task_id>/profile_<node_name>.<timestamp>.<rank>.<timestamp>.pt.trace.json查看方法:使用 TensorBoard 或 Perfetto UI
2. Nsight Systems 结果(使用 --nsys=true 时,注意:当开启 nsys 时,PyTorch Profiler 自动关闭)
文件格式:.nsys-rep
位置:
<output_dir>/<task_id>/profile_<node_name>.<timestamp>.nsys-rep查看方法:使用 Nsight Systems GUI
变量含义
task_id 为 TI_INSTANCE_ID 环境变量的值,由 TI-ONE 平台自动注入(若为任务式建模,即为训练任务记录 ID;若为开发机,即为开发机实例 ID)
node_name 为 NODE_NAME 环境变量的值
rank 为 RANK 环境变量的值
timestamp 为当前时间戳
查看 PyTorch Profiler 结果
使用 Perfetto UI
使用 TensorBoard 查看分析结果(直接输入命令查看或者使用平台的 Tensorboard 面板):
直接输入命令查看:
# 启动 TensorBoardtensorboard --logdir=./# 在浏览器中打开 http://localhost:6006
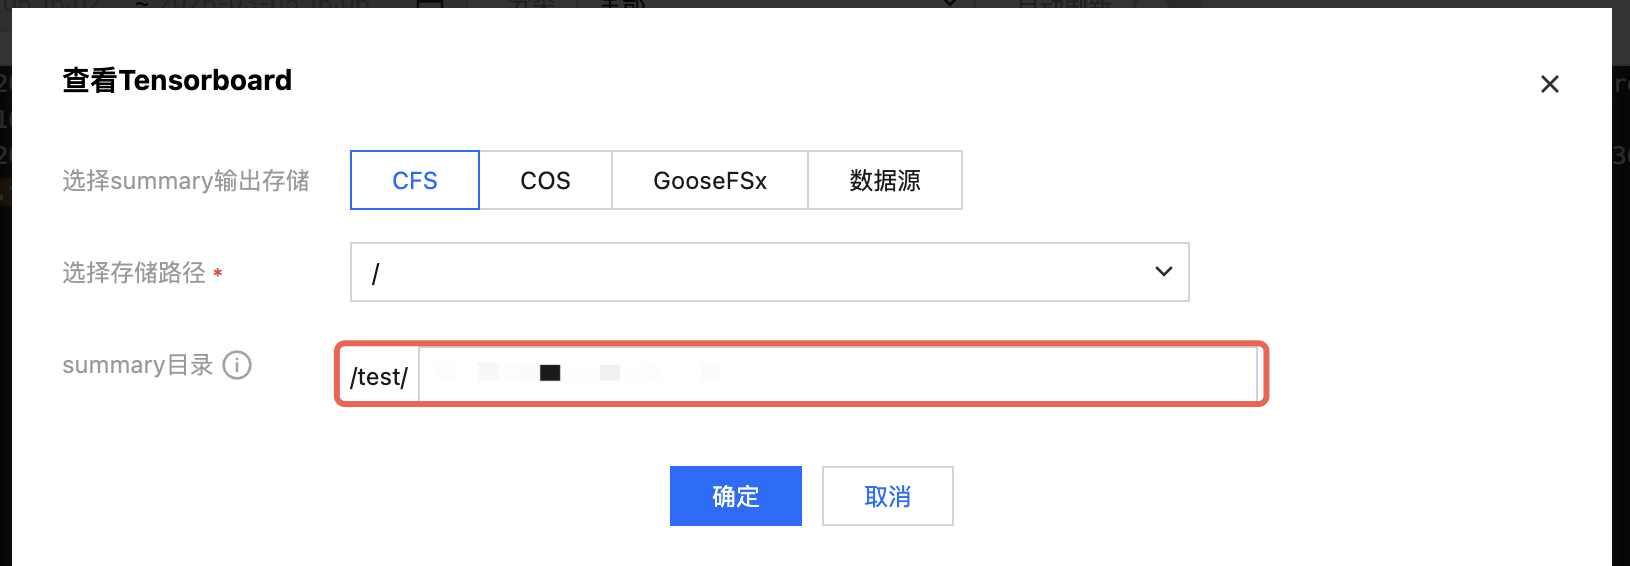
使用任务式建模 Tensorboard 功能查看:
任务式建模已经集成了 Tensorboard,您可以直接单击任务列表或者详情页的 Tensorboard 操作按钮,输入 trace 文件所在路径即可查看。
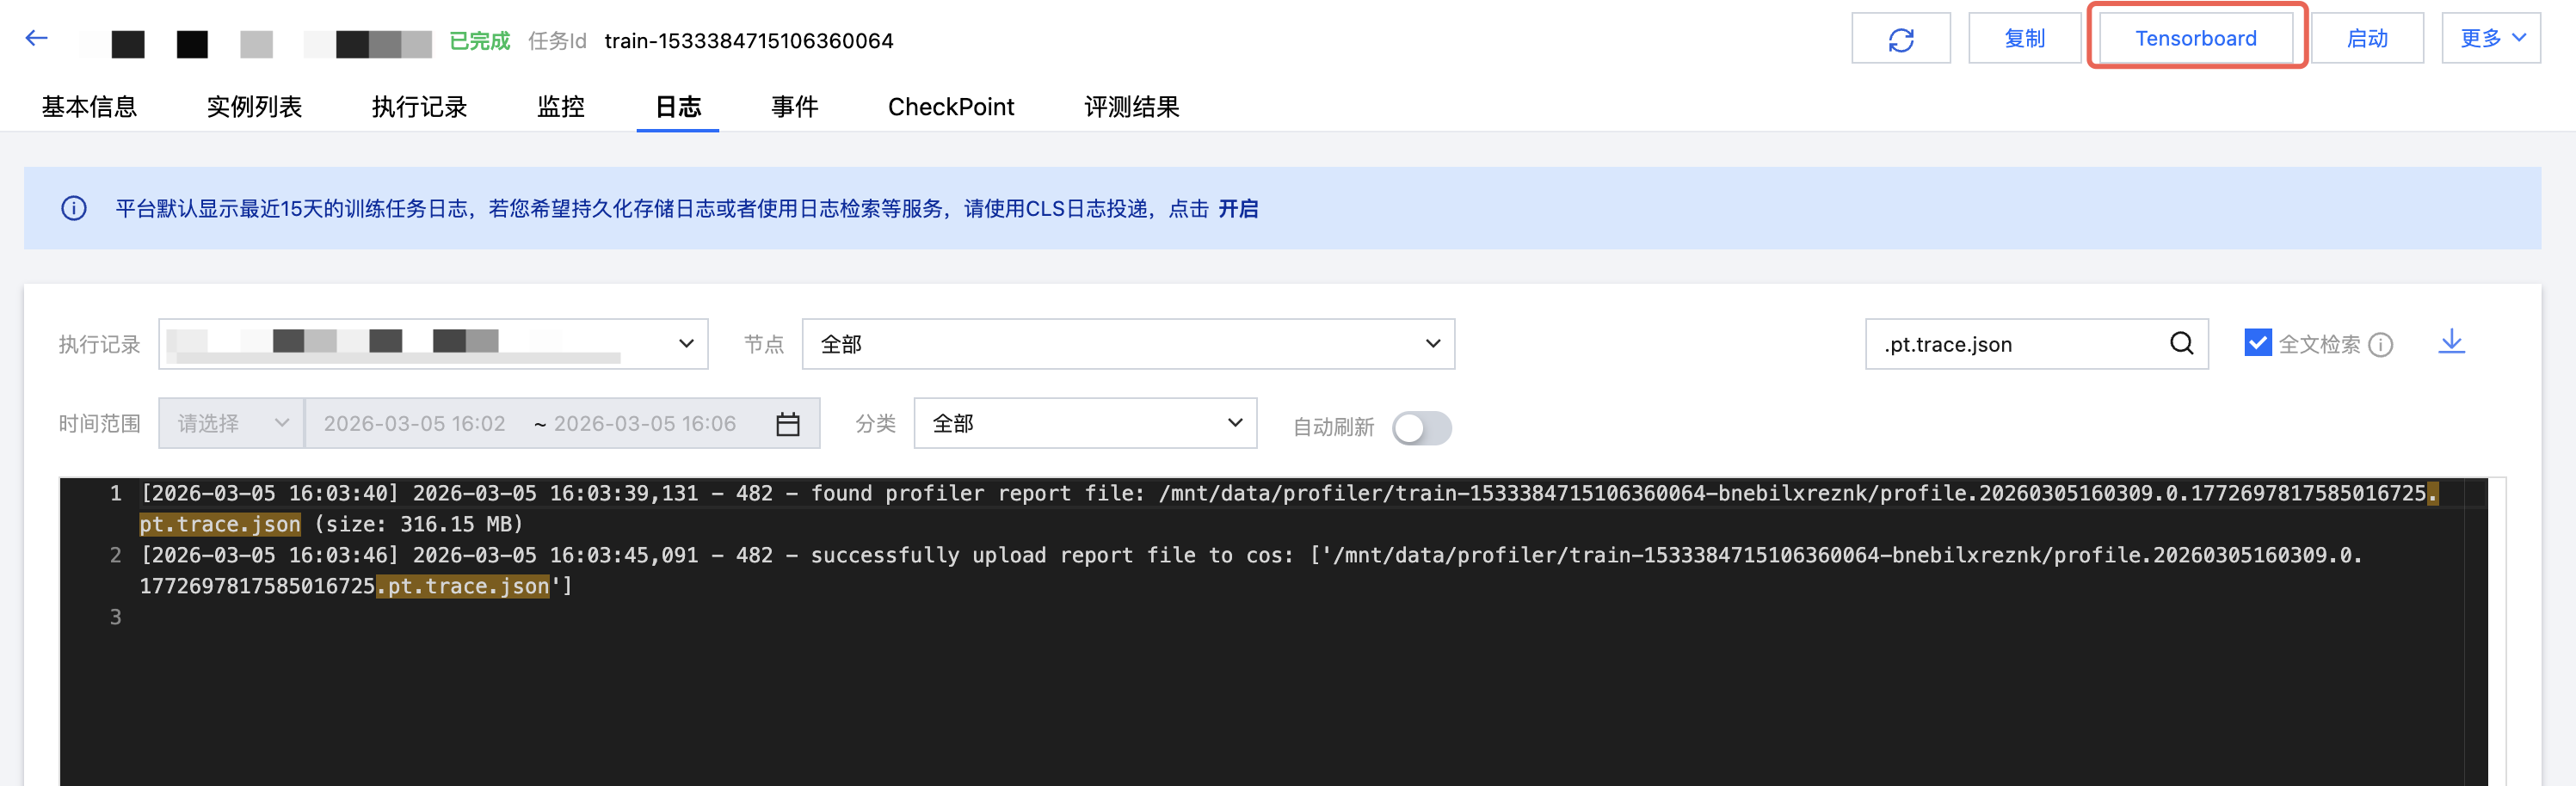
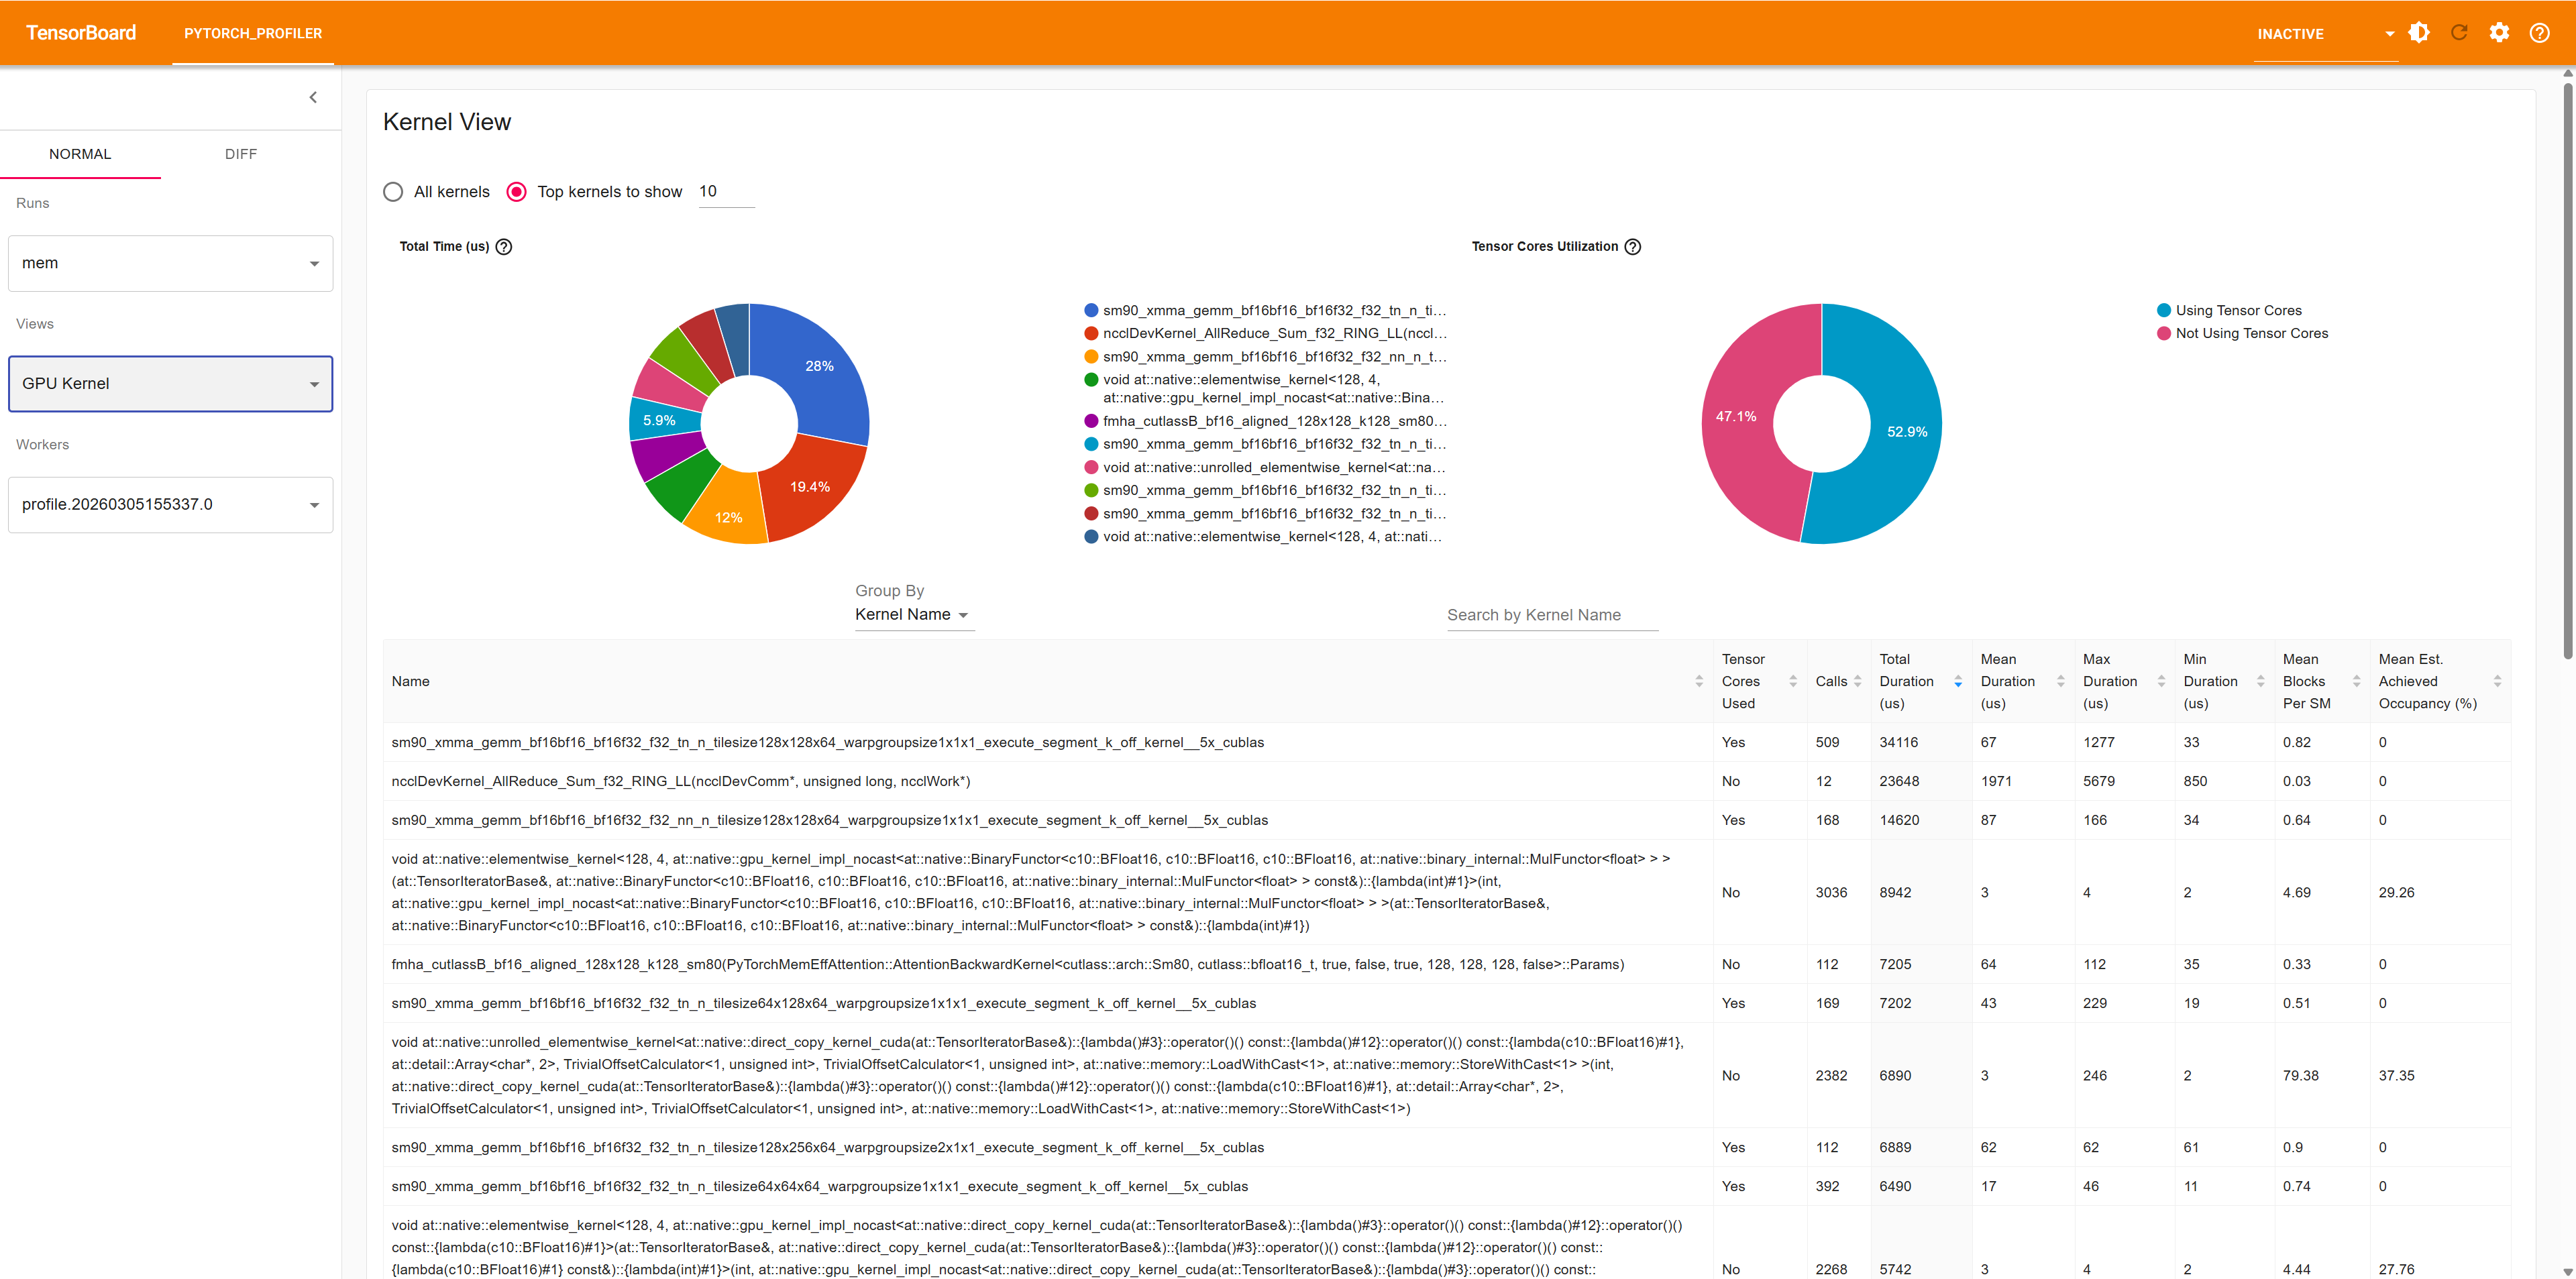
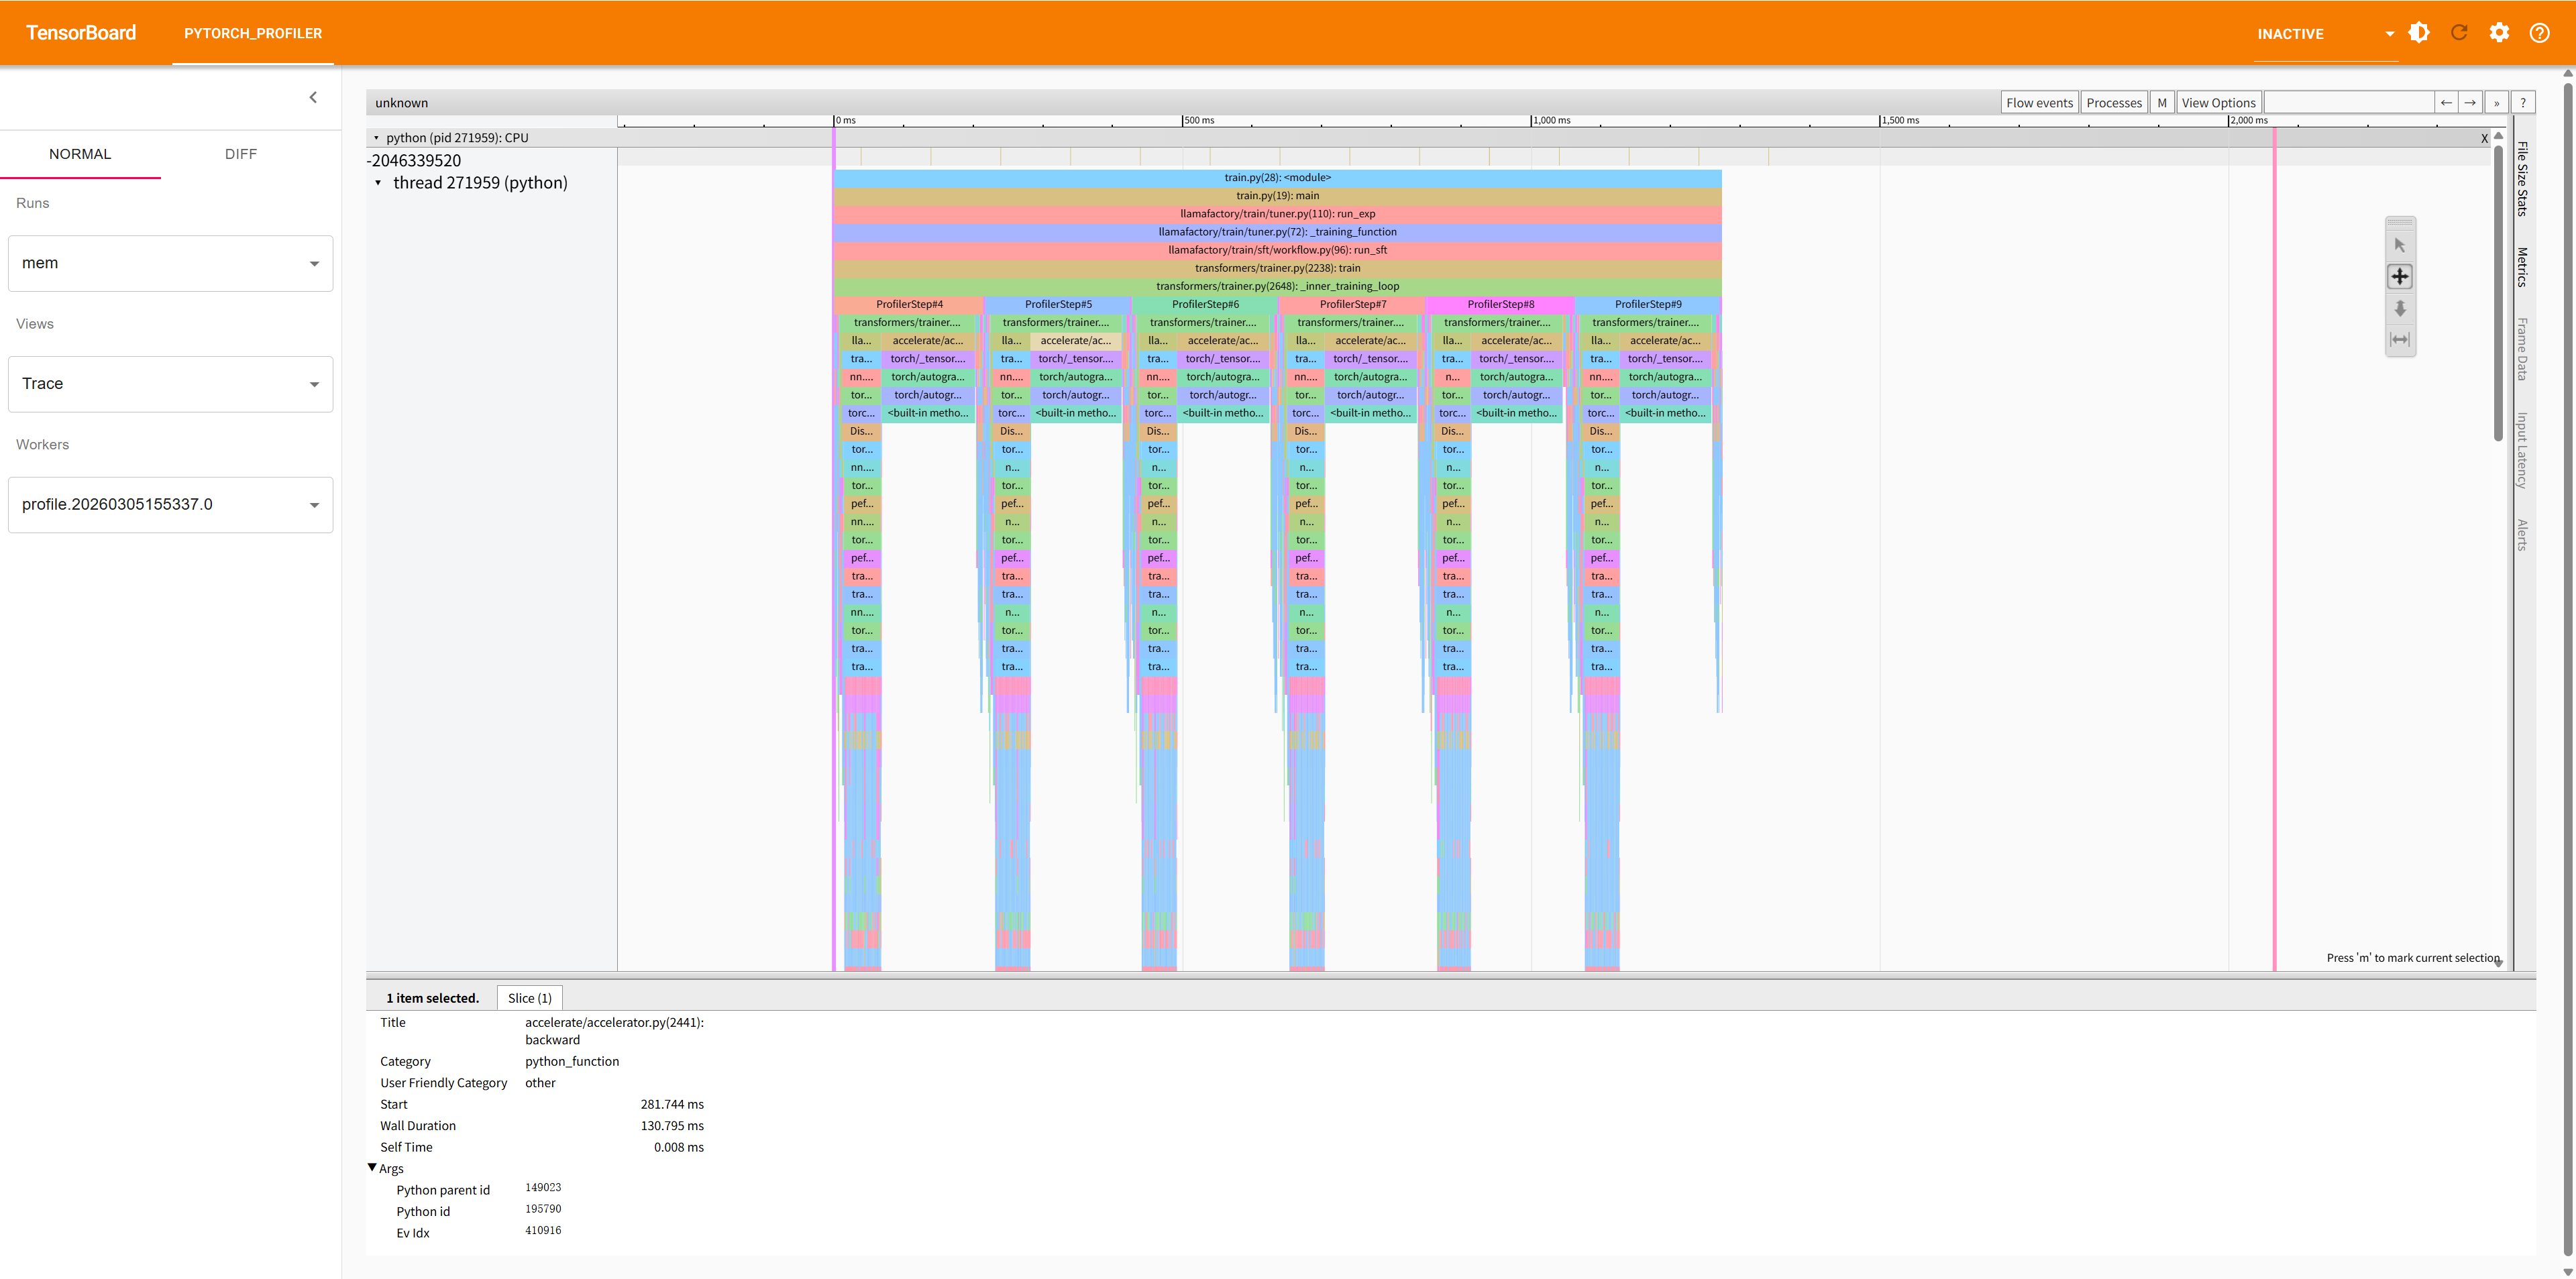
查看 Tensorboard 的界面如下:
TensorBoard 提供的视图:
Overview:整体性能概览
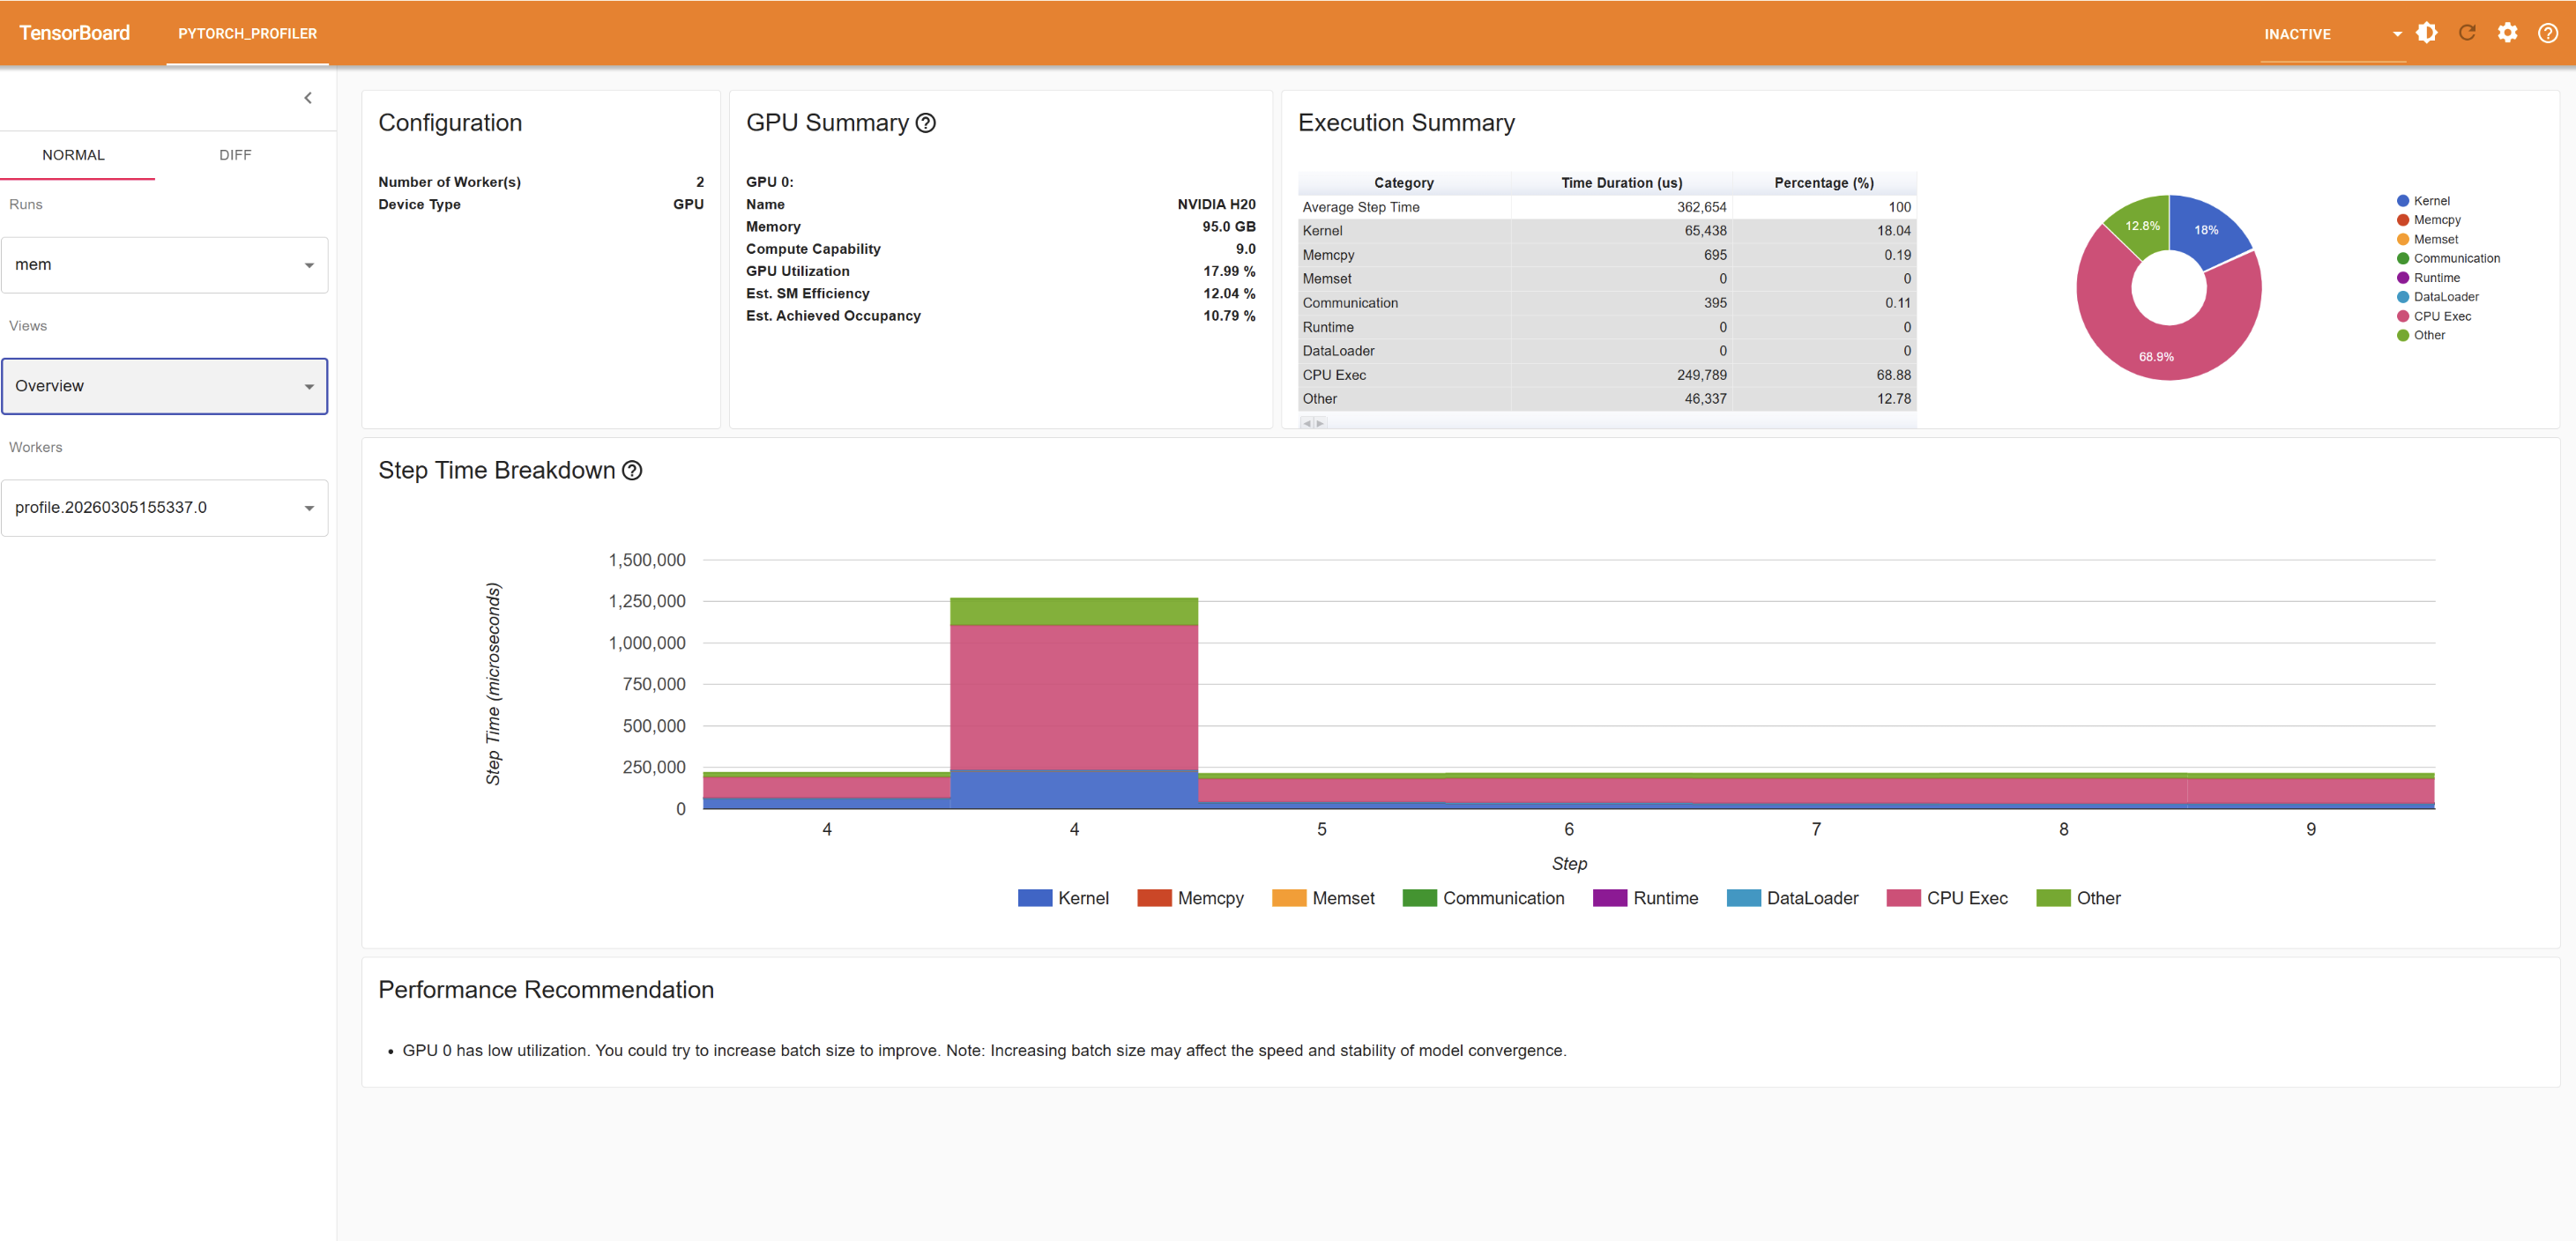
Operator View:算子级别的性能统计
Kernel View:CUDA kernel 性能统计
Trace View:时间线视图,显示算子执行顺序
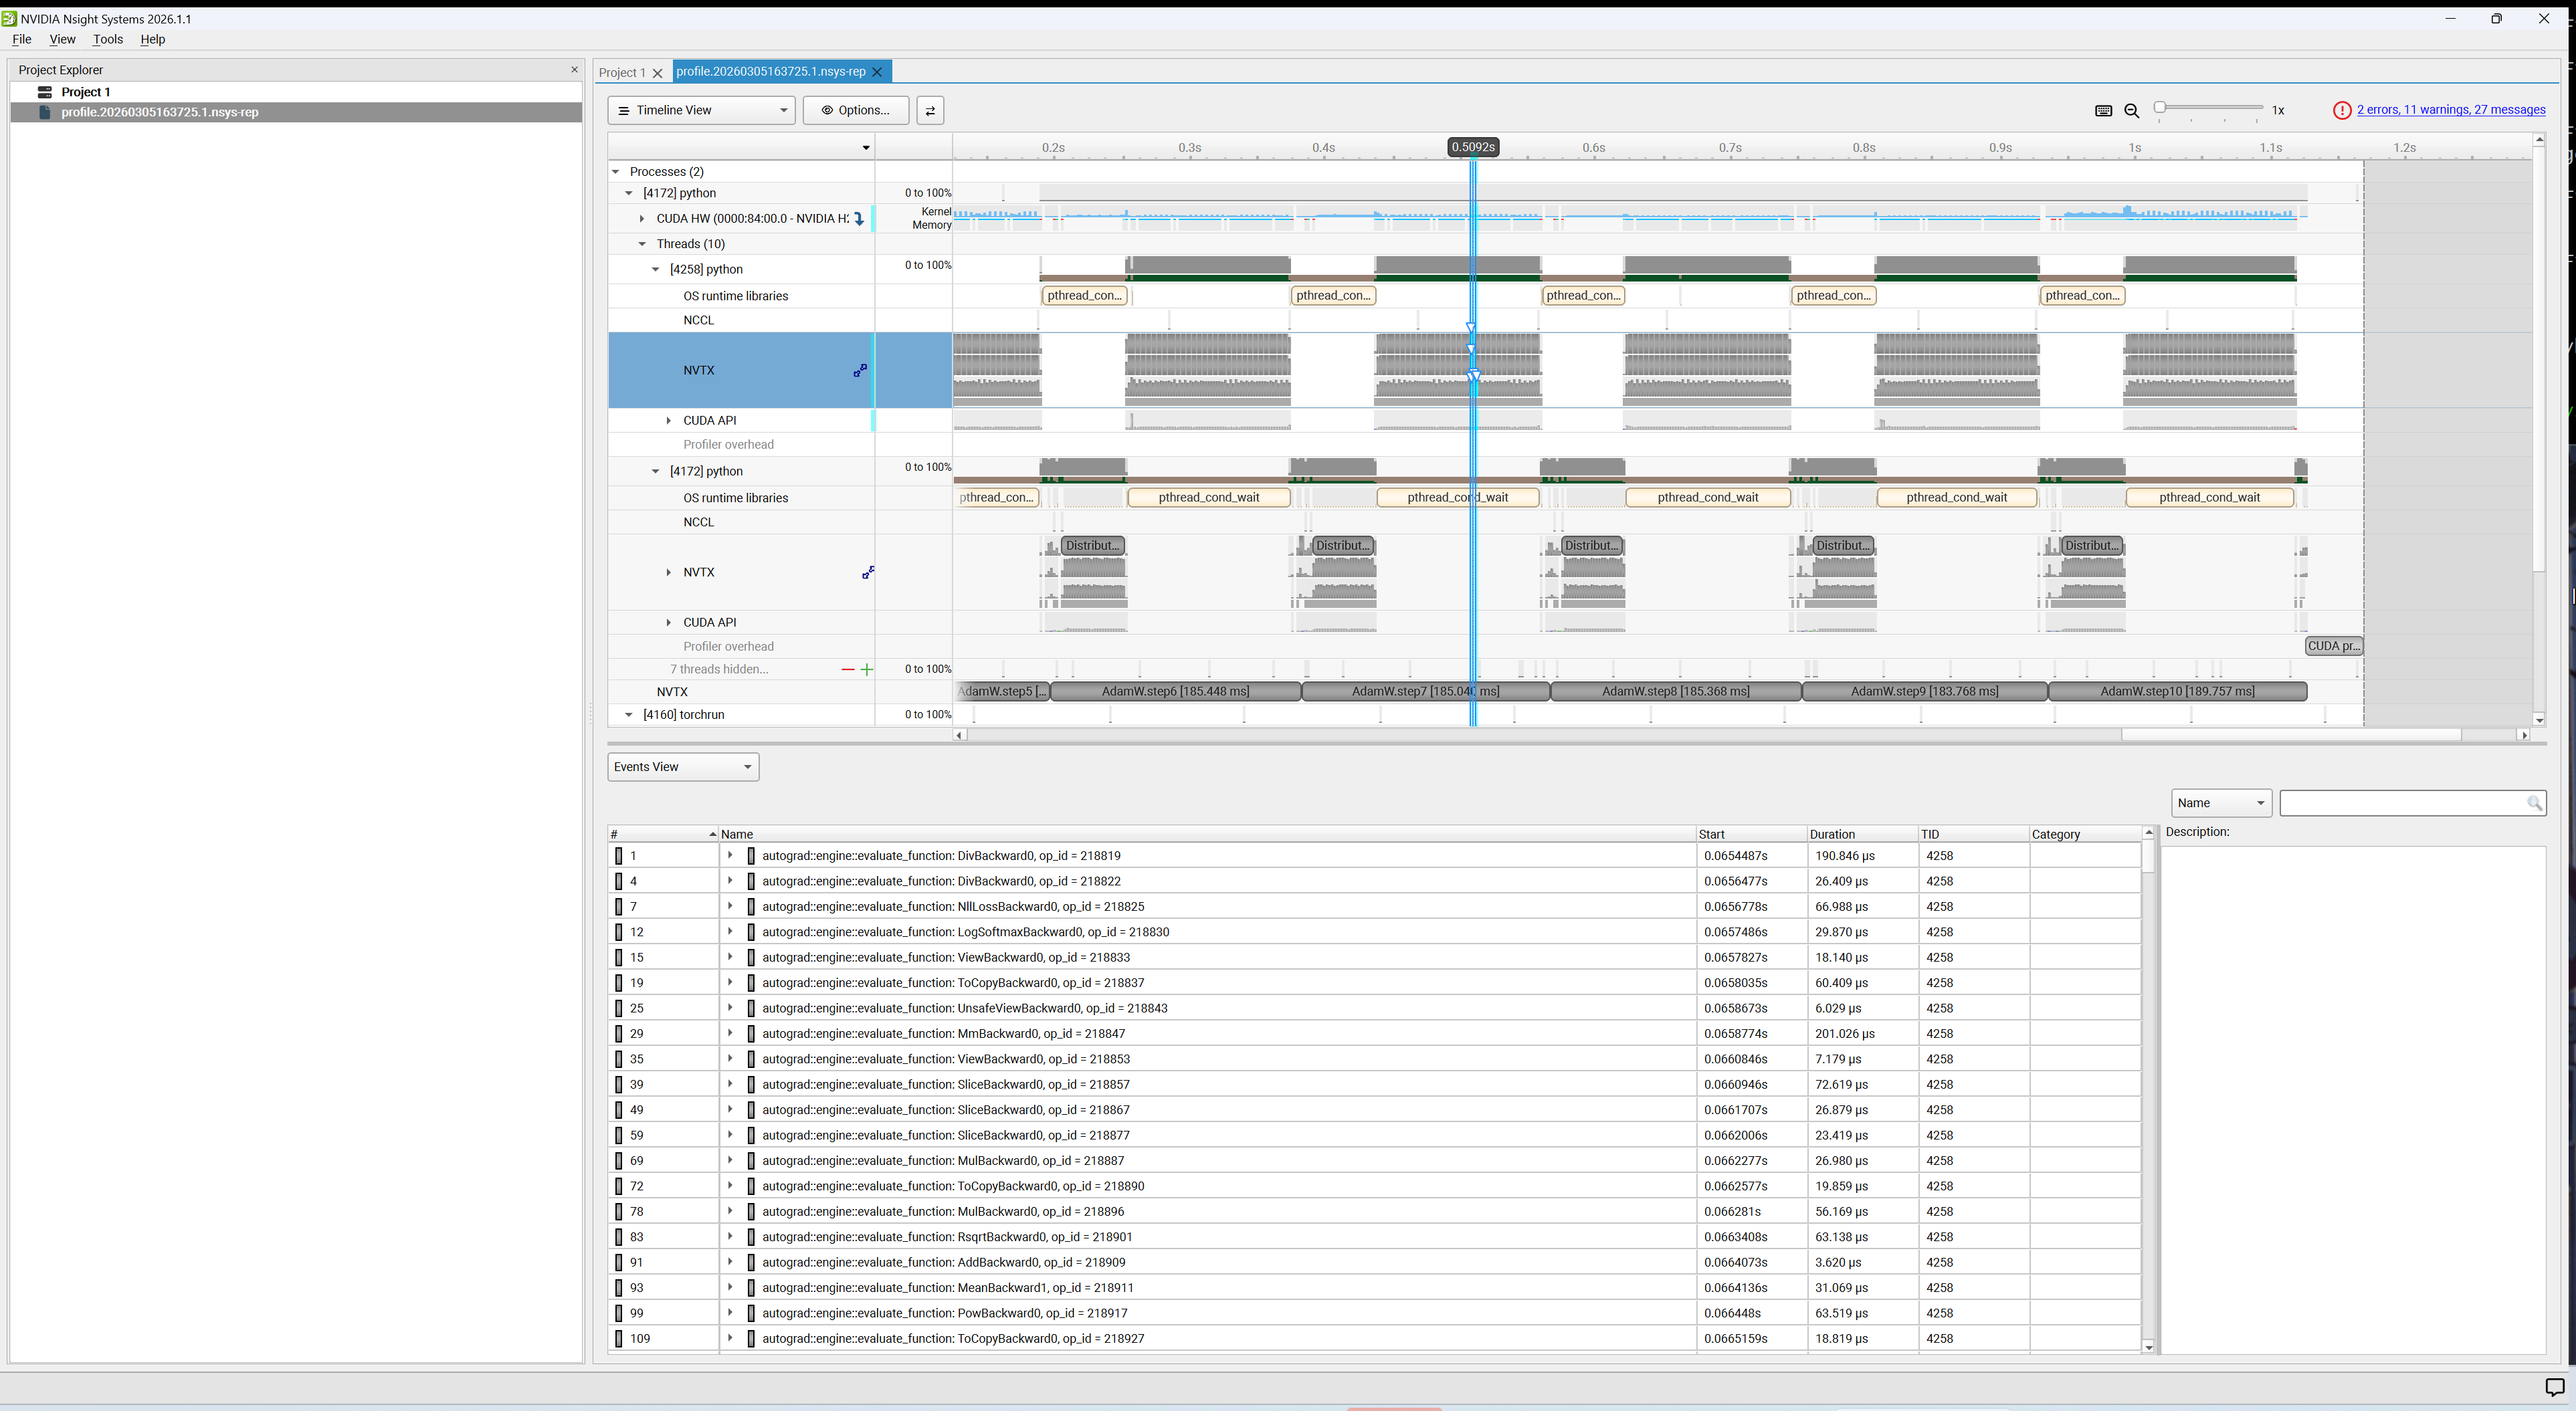
查看 Nsight Systems 结果
1. 下载并安装 Nsight Systems。
2. 打开 Nsight Systems GUI。
3. 单击 File > Open,选择 .nsys-rep 文件。
4. 分析时间线、CUDA kernel、内存传输等信息。
命令行参数
参数概览
参数 | 类型 | 默认值 | 描述 |
--steps | str | None | 指定要分析的训练步骤范围,格式:"start-end,start-end",例如 "10-15,20-25" |
--durations | str | None | 指定要分析的时间范围(秒),格式:"start-end,start-end",例如 "30-60,90-120" 注意:--steps 和 --durations 参数互斥,只能使用其中一个 |
--ranks | str | "0" | 指定要分析的 rank,多个 rank 用逗号分隔,例如 "0,1,2",默认分析所有 rank |
--nsys | flag | False | 启用 Nsight Systems |
--output | str | "file:///mnt/data/profiler" | 输出位置,支持本地路径 file://{实际路径} 或腾讯云 COS cos://bucket/path |
--profiler-args | str | None | 传递给 PyTorch Profiler 或 Nsight Systems 的额外参数,格式:"key1=value1; key2=value2" PyTorch Profiler 参数详见 文档 Nsight Systems 参数详见 文档 |
参数详细说明
1. --steps 参数
指定要分析的训练步骤范围。支持多个范围,用逗号分隔:
# 分析第 5-10 步tiprof --steps 5-10 python train.py# 分析第 5-10 步和第 20-30 步tiprof --steps 5-10,20-30 python train.py
2. --durations 参数
指定要分析的时间范围(从训练开始计时,单位:秒):
# 分析训练开始后 30-40 秒tiprof --durations 30-40 python train.py# 分析多个时间段tiprof --durations 30-40,100-110 python train.py
3. --ranks 参数
在分布式训练中,指定要分析的 rank:
# 只分析 rank 0tiprof --ranks 0 python train.py# 分析 rank 0, 1, 2tiprof --ranks 0,1,2 python train.py
4. --nsys 参数
启用 Nsight Systems 进行系统级性能分析。Nsight Systems 提供更底层的 CUDA kernel、内存传输等信息:
tiprof --nsys=true python train.py
PyTorch Profiler vs Nsight Systems:
PyTorch Profiler:专注于 PyTorch 算子级别的性能分析,适合分析模型结构和算子性能。
Nsight Systems:提供系统级性能分析,包括 CUDA kernel、内存传输、CPU 活动等,适合深入分析底层性能。
5. --output 参数
指定分析结果的输出位置:
# 输出到本地目录tiprof --output file:///path/to/output python train.py# 输出到腾讯云 COStiprof --output cos://my-bucket/profiling-results python train.py
6. --profiler-args 参数
PyTorch Profiler 支持的参数
PyTorch Profiler 默认参数配置为 record_shapes=True;with_stack=True,即默认开启 record_shapes 和 with_stack,您可以修改该参数配置,也可以额外添加其他参数,例如设置 profile_memory=True。
修改默认参数配置:
tiprof --profiler-args "record_shapes=False;with_stack=True" python train.py
配置额外参数:
tiprof --profiler-args "profile_memory=True" python train.py
Nsight Systems 支持的参数
如上,Nsight Systems 默认参数配置如下:
tiprof --profiler-args "--trace=cuda,nvtx,osrt;--pytorch=autograd-nvtx;--trace-fork-before-exec=true;--stop-on-exit=true" python train.py
添加额外参数:
tiprof --profiler-args "--python-sampling=true;--python-backtrace=cuda;--cudabacktrace=all" python train.py


