重磅!Python台风路径还能这样画

重磅!Python台风路径还能这样画

用户11172986
发布于 2024-06-20 17:10:47
发布于 2024-06-20 17:10:47
读者来信,想优化一版台风路径绘制 在检索了半天终于找到一个库,tcmarkers。
可以与matplotlib相配合绘制出台风图标,说白了就是提供个marker的矢量文件。Python,很强大吧。
原程序
In [1]:
import os
import pandas as pd
import numpy as np
from pathlib import Path
from typing import List
from typing import Union
from typing import Tuple
from matplotlib.collections import LineCollection
import matplotlib.pyplot as plt
import cartopy.crs as ccrs
import cartopy.feature as cfeature
from cartopy.mpl.ticker import LongitudeFormatter
from cartopy.mpl.ticker import LatitudeFormatter
import cartopy.feature as cfeat
import cmaps
def reader(
    typhoon_txt: os.PathLike, code: Union[str, int]
) -> Tuple[List[str], pd.DataFrame]:
    typhoon_txt = Path(typhoon_txt)
    if isinstance(code, int):
        code = "{:04}".format(code)
    with open(typhoon_txt, "r") as txt_handle:
        while True:
            header = txt_handle.readline().split()
            if not header:
                raise ValueError(f"没有在文件里找到编号为{code}的台风")
            if header[4].strip() == code:
                break
            [txt_handle.readline() for _ in range(int(header[2]))]
        data_path = pd.read_table(
            txt_handle,
            sep=r"\s+",
            header=None,
            names=["TIME", "I", "LAT", "LONG", "PRES", "WND", "OWD"],
            nrows=int(header[2]),
            dtype={
                "I": np.int,
                "LAT": np.float32,
                "LONG": np.float32,
                "PRES": np.float32,
                "WND": np.float32,
                "OWD": np.float32,
            },
            parse_dates=True,
            date_parser=lambda x: pd.to_datetime(x, format=f"%Y%m%d%H"),
            index_col="TIME",
        )
        data_path["LAT"] = data_path["LAT"] / 10
        data_path["LONG"] = data_path["LONG"] / 10
        return header, data_path

head, dat = reader(r"/home/mw/project/CH2014BST(1).txt",'1409')
#print(dat)
lat = dat.LAT
lon = dat.LONG
level = dat.I
pressure = dat.PRES
#创建Figure
fig = plt.figure(figsize=(15, 12), dpi = 150)
#绘制台风路径
ax2 = fig.add_subplot(1,2,2, projection=ccrs.PlateCarree())
#设置ax2的范围
ax2.set_extent([80,160,0,40])
#为ax1添加海岸线
ax2.coastlines()
ax2.add_feature(cfeat.LAND, alpha = 0.2) #添加大陆特征
ax2.add_feature(cfeat.OCEAN, alpha = 0.5)
#为ax2添加地理经纬度标签及刻度
ax2.set_xticks(np.arange(80,170,10), crs=ccrs.PlateCarree())
ax2.set_yticks(np.arange(0,50,10), crs=ccrs.PlateCarree())
lon_formatter = LongitudeFormatter()
lat_formatter = LatitudeFormatter()
ax2.xaxis.set_major_formatter(lon_formatter)
ax2.yaxis.set_major_formatter(lat_formatter)
# ax2.xaxis.set_major_formatter(cticker.LongitudeFormatter())
# ax2.yaxis.set_major_formatter(cticker.LatitudeFormatter())
#将经纬度数据点存入同一数组
points = np.array([lon, lat]).T.reshape(-1, 1, 2)
segments = np.concatenate([points[:-1], points[1:]], axis=1)
#设置色标的标准化范围(即将Z维度的数据对应为颜色数组)
#norm = plt.Normalize(0, 80)   #中心风速的色标
norm = plt.Normalize(0, 6)  #台风等级的色标
#设置颜色线条
lc = LineCollection(segments, cmap=cmaps.radar, norm=norm,transform=ccrs.PlateCarree())
#lc.set_array(dat.WND[:-1])#颜色用中心风速表示
lc.set_array(level[:-1])#颜色用台风等级表示

#绘制线条
line = ax2.add_collection(lc)
fig.colorbar(lc,ax=ax2,fraction=0.04)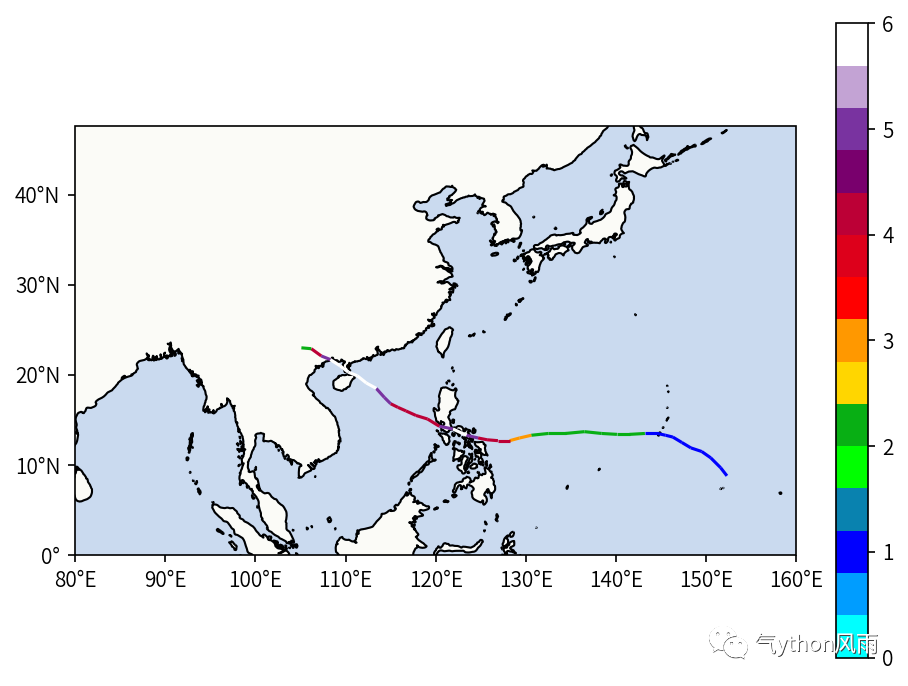
原数据
In [2]:
datI | LAT | LONG | PRES | WND | OWD | |
|---|---|---|---|---|---|---|
TIME | ||||||
2014-07-10 00:00:00 | 1 | 8.800000 | 152.300003 | 1008.0 | 13.0 | NaN |
2014-07-10 06:00:00 | 1 | 9.700000 | 151.600006 | 1008.0 | 13.0 | NaN |
2014-07-10 12:00:00 | 1 | 10.800000 | 150.500000 | 1008.0 | 13.0 | NaN |
2014-07-10 18:00:00 | 1 | 11.500000 | 149.500000 | 1006.0 | 15.0 | NaN |
2014-07-11 00:00:00 | 1 | 11.900000 | 148.300003 | 1006.0 | 15.0 | NaN |
2014-07-11 06:00:00 | 1 | 12.500000 | 147.300003 | 1006.0 | 15.0 | NaN |
2014-07-11 12:00:00 | 1 | 13.100000 | 146.300003 | 1006.0 | 15.0 | NaN |
2014-07-11 18:00:00 | 1 | 13.300000 | 145.500000 | 1006.0 | 15.0 | NaN |
2014-07-12 00:00:00 | 1 | 13.500000 | 144.600006 | 1006.0 | 15.0 | NaN |
2014-07-12 06:00:00 | 2 | 13.500000 | 143.199997 | 1002.0 | 18.0 | NaN |
2014-07-12 12:00:00 | 2 | 13.400000 | 141.500000 | 998.0 | 20.0 | NaN |
2014-07-12 18:00:00 | 2 | 13.400000 | 140.100006 | 998.0 | 20.0 | NaN |
2014-07-13 00:00:00 | 2 | 13.500000 | 138.399994 | 998.0 | 20.0 | NaN |
2014-07-13 06:00:00 | 2 | 13.700000 | 136.500000 | 998.0 | 20.0 | NaN |
2014-07-13 12:00:00 | 2 | 13.500000 | 134.399994 | 992.0 | 23.0 | NaN |
2014-07-13 18:00:00 | 2 | 13.500000 | 132.500000 | 992.0 | 23.0 | NaN |
2014-07-14 00:00:00 | 3 | 13.300000 | 130.600006 | 990.0 | 25.0 | NaN |
2014-07-14 06:00:00 | 3 | 13.000000 | 129.300003 | 980.0 | 30.0 | NaN |
2014-07-14 12:00:00 | 4 | 12.700000 | 128.199997 | 970.0 | 35.0 | NaN |
2014-07-14 18:00:00 | 4 | 12.700000 | 126.900002 | 960.0 | 40.0 | NaN |
2014-07-15 00:00:00 | 4 | 12.800000 | 125.699997 | 960.0 | 40.0 | NaN |
2014-07-15 06:00:00 | 5 | 13.000000 | 124.699997 | 945.0 | 48.0 | NaN |
2014-07-15 12:00:00 | 6 | 13.300000 | 123.400002 | 930.0 | 55.0 | NaN |
2014-07-15 18:00:00 | 5 | 14.000000 | 121.900002 | 940.0 | 50.0 | NaN |
2014-07-16 00:00:00 | 4 | 14.300000 | 120.400002 | 960.0 | 40.0 | NaN |
2014-07-16 06:00:00 | 4 | 15.100000 | 119.099998 | 975.0 | 33.0 | NaN |
2014-07-16 12:00:00 | 4 | 15.500000 | 117.800003 | 970.0 | 35.0 | NaN |
2014-07-16 18:00:00 | 4 | 16.000000 | 116.699997 | 965.0 | 38.0 | NaN |
2014-07-17 00:00:00 | 4 | 16.400000 | 115.800003 | 960.0 | 40.0 | NaN |
2014-07-17 06:00:00 | 5 | 16.799999 | 115.000000 | 950.0 | 45.0 | NaN |
2014-07-17 12:00:00 | 5 | 17.500000 | 114.300003 | 930.0 | 50.0 | NaN |
2014-07-17 18:00:00 | 6 | 18.500000 | 113.400002 | 920.0 | 58.0 | NaN |
2014-07-18 00:00:00 | 6 | 19.100000 | 112.300003 | 900.0 | 65.0 | NaN |
2014-07-18 06:00:00 | 6 | 19.900000 | 111.300003 | 888.0 | 72.0 | NaN |
2014-07-18 12:00:00 | 6 | 20.299999 | 110.300003 | 910.0 | 60.0 | NaN |
2014-07-18 18:00:00 | 6 | 21.000000 | 109.400002 | 935.0 | 52.0 | NaN |
2014-07-19 00:00:00 | 5 | 21.700001 | 108.300003 | 945.0 | 48.0 | NaN |
2014-07-19 06:00:00 | 4 | 22.100000 | 107.300003 | 970.0 | 33.0 | NaN |
2014-07-19 12:00:00 | 2 | 22.900000 | 106.199997 | 990.0 | 23.0 | NaN |
2014-07-19 18:00:00 | 2 | 23.000000 | 105.099998 | 996.0 | 18.0 | NaN |
库安装与官方示例
In [3]:
!pip install tcmarkers -i https://pypi.mirrors.ustc.edu.cn/simple/Looking in indexes: https://pypi.mirrors.ustc.edu.cn/simple/
Collecting tcmarkers
Downloading https://mirrors.bfsu.edu.cn/pypi/web/packages/c7/6e/04ba09ea27742c7d448d65dd521f84cf772cbf455e0eb14b5368837011bf/tcmarkers-0.0.3-py3-none-any.whl (6.9 kB)
Requirement already satisfied: numpy in /opt/conda/lib/python3.7/site-packages (from tcmarkers) (1.21.2)
Requirement already satisfied: matplotlib in /opt/conda/lib/python3.7/site-packages (from tcmarkers) (3.5.0)
Requirement already satisfied: kiwisolver>=1.0.1 in /opt/conda/lib/python3.7/site-packages (from matplotlib->tcmarkers) (1.2.0)
Requirement already satisfied: pyparsing>=2.2.1 in /opt/conda/lib/python3.7/site-packages (from matplotlib->tcmarkers) (2.4.7)
Requirement already satisfied: packaging>=20.0 in /opt/conda/lib/python3.7/site-packages (from matplotlib->tcmarkers) (20.4)
Requirement already satisfied: python-dateutil>=2.7 in /opt/conda/lib/python3.7/site-packages (from matplotlib->tcmarkers) (2.8.1)
Requirement already satisfied: cycler>=0.10 in /opt/conda/lib/python3.7/site-packages (from matplotlib->tcmarkers) (0.10.0)
Requirement already satisfied: fonttools>=4.22.0 in /opt/conda/lib/python3.7/site-packages (from matplotlib->tcmarkers) (4.28.2)
Requirement already satisfied: setuptools-scm>=4 in /opt/conda/lib/python3.7/site-packages (from matplotlib->tcmarkers) (6.3.2)
Requirement already satisfied: pillow>=6.2.0 in /opt/conda/lib/python3.7/site-packages (from matplotlib->tcmarkers) (7.2.0)
Requirement already satisfied: six in /opt/conda/lib/python3.7/site-packages (from packaging>=20.0->matplotlib->tcmarkers) (1.15.0)
Requirement already satisfied: setuptools in /opt/conda/lib/python3.7/site-packages (from setuptools-scm>=4->matplotlib->tcmarkers) (49.3.0.post20200809)
Requirement already satisfied: tomli>=1.0.0 in /opt/conda/lib/python3.7/site-packages (from setuptools-scm>=4->matplotlib->tcmarkers) (1.2.2)
Installing collected packages: tcmarkers
Successfully installed tcmarkers-0.0.3In [4]:
import matplotlib.pyplot as plt
import tcmarkers

fig = plt.figure()
ax = fig.add_subplot(111)

# 设置符号的参数
marker_kwargs = {'markersize': 25, 'color': 'r', 'markeredgecolor': 'r'}

# 绘制台风符号

ax.plot(0, 0.25, marker=tcmarkers.TS, **marker_kwargs)
ax.plot(0.25, 0.20, marker=tcmarkers.SH_TS, **marker_kwargs)


# 显示图形
plt.show()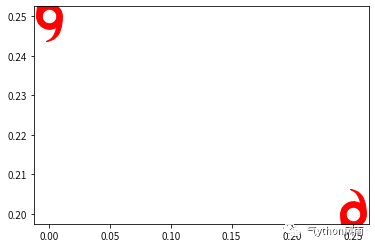
In [5]:
import matplotlib.pyplot as plt
import tcmarkers


fig = plt.figure()
ax = fig.add_subplot(111)

for i, vmax in enumerate([33, 34, 64,]):
    ax.plot(i, 2, marker=tcmarkers.tc_marker(vmax), color='r', markeredgecolor='r', markersize=10)
    # pass latitude and SH storms returned for lat < 0
ax.plot(i, 1, marker=tcmarkers.tc_marker(vmax, -30), color='r', markeredgecolor='r', markersize=10)fig.show()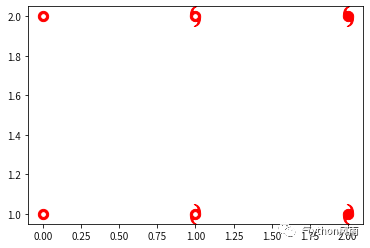
优化1.0版
将风速表示台风强度修改为等级显示 线段至上加绘台风图标
In [6]:
import os
import pandas as pd
import numpy as np
from pathlib import Path
from typing import List
from typing import Union
from typing import Tuple
from matplotlib.collections import LineCollection
import matplotlib.pyplot as plt
import cartopy.crs as ccrs
import cartopy.feature as cfeature
from cartopy.mpl.ticker import LongitudeFormatter
from cartopy.mpl.ticker import LatitudeFormatter
import cartopy.feature as cfeat
import tcmarkers
def reader(
    typhoon_txt: os.PathLike, code: Union[str, int]
) -> Tuple[List[str], pd.DataFrame]:
    typhoon_txt = Path(typhoon_txt)
    if isinstance(code, int):
        code = "{:04}".format(code)
    with open(typhoon_txt, "r") as txt_handle:
        while True:
            header = txt_handle.readline().split()
            if not header:
                raise ValueError(f"没有在文件里找到编号为{code}的台风")
            if header[4].strip() == code:
                break
            [txt_handle.readline() for _ in range(int(header[2]))]
        data_path = pd.read_table(
            txt_handle,
            sep=r"\s+",
            header=None,
            names=["TIME", "I", "LAT", "LONG", "PRES", "WND", "OWD"],
            nrows=int(header[2]),
            dtype={
                "I": np.int,
                "LAT": np.float32,
                "LONG": np.float32,
                "PRES": np.float32,
                "WND": np.float32,
                "OWD": np.float32,
            },
            parse_dates=True,
            date_parser=lambda x: pd.to_datetime(x, format=f"%Y%m%d%H"),
            index_col="TIME",
        )
        data_path["LAT"] = data_path["LAT"] / 10
        data_path["LONG"] = data_path["LONG"] / 10
        return header, data_path

head, dat = reader(r"/home/mw/project/CH2014BST(1).txt",'1409')
#print(dat)
lat = dat.LAT
lon = dat.LONG
level = dat.I
pressure = dat.PRES
#创建Figure
fig = plt.figure(figsize=(15, 12), dpi = 150)
#绘制台风路径
ax2 = fig.add_subplot(1,2,2, projection=ccrs.PlateCarree())
#设置ax2的范围
ax2.set_extent([80,160,0,40])
#为ax1添加海岸线
ax2.coastlines()
ax2.add_feature(cfeat.LAND, alpha = 0.2) #添加大陆特征
ax2.add_feature(cfeat.OCEAN, alpha = 0.5)
#为ax2添加地理经纬度标签及刻度
ax2.set_xticks(np.arange(80,170,10), crs=ccrs.PlateCarree())
ax2.set_yticks(np.arange(0,50,10), crs=ccrs.PlateCarree())
lon_formatter = LongitudeFormatter()
lat_formatter = LatitudeFormatter()
ax2.xaxis.set_major_formatter(lon_formatter)
ax2.yaxis.set_major_formatter(lat_formatter)
# ax2.xaxis.set_major_formatter(cticker.LongitudeFormatter())
# ax2.yaxis.set_major_formatter(cticker.LatitudeFormatter())
#将经纬度数据点存入同一数组
points = np.array([lon, lat]).T.reshape(-1, 1, 2)
segments = np.concatenate([points[:-1], points[1:]], axis=1)
#设置色标的标准化范围(即将Z维度的数据对应为颜色数组)
#norm = plt.Normalize(0, 80)   #中心风速的色标
norm = plt.Normalize(1, 6)  #台风等级的色标
# #设置颜色线条
colors = ['#FFFF00', '#6495ED', '#3CB371', '#FFA500','#FF00FF', '#DC143C']
cmap = plt.cm.colors.ListedColormap(colors)
lc = LineCollection(segments, cmap=cmap, norm=norm,transform=ccrs.PlateCarree())
#lc.set_array(dat.WND[:-1])#颜色用中心风速表示
lc.set_array(level[:-1])#颜色用台风等级表示
# #绘制线条
line = ax2.add_collection(lc)
fig.colorbar(lc,ax=ax2,fraction=0.04)
# 绘制图标
for lon_i, lat_i, level in zip(lon, lat, level):
    # 根据风力等级设置图标颜色
    if level == 1:
        color = colors[level-1]
    elif level == 2:
        color = colors[level-1]
    elif level == 3:
        color = colors[level-1]
    elif level == 4:
        color = colors[level-1]
    elif level == 5:
        color = colors[level-1]
    elif level == 6:
        color = colors[level-1]
    # 绘制台风图标
    ax2.plot(lon_i, lat_i, marker=tcmarkers.TS, markersize=3, color=color)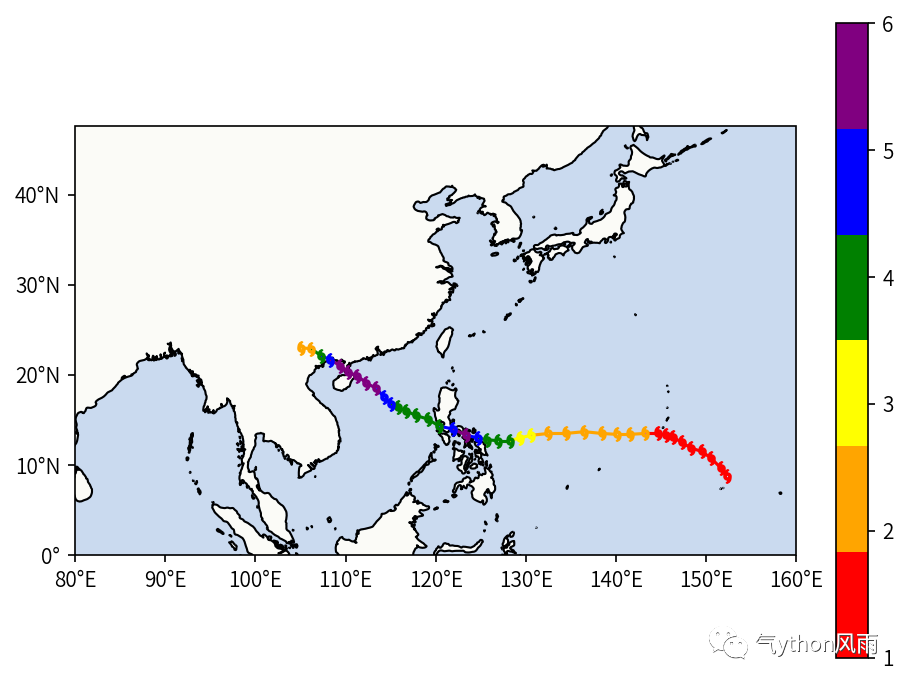
优化2.0
对线段显示进行调整,并增加图例
import os
import pandas as pd
import numpy as np
from pathlib import Path
from typing import List
from typing import Union
from typing import Tuple
from matplotlib.collections import LineCollection
import matplotlib.pyplot as plt
from matplotlib.lines import Line2D
import cartopy.crs as ccrs
import cartopy.feature as cfeature
from cartopy.mpl.ticker import LongitudeFormatter
from cartopy.mpl.ticker import LatitudeFormatter
import cartopy.feature as cfeat
import tcmarkers
def reader(
    typhoon_txt: os.PathLike, code: Union[str, int]
) -> Tuple[List[str], pd.DataFrame]:
    typhoon_txt = Path(typhoon_txt)
    if isinstance(code, int):
        code = "{:04}".format(code)
    with open(typhoon_txt, "r") as txt_handle:
        while True:
            header = txt_handle.readline().split()
            if not header:
                raise ValueError(f"没有在文件里找到编号为{code}的台风")
            if header[4].strip() == code:
                break
            [txt_handle.readline() for _ in range(int(header[2]))]
        data_path = pd.read_table(
            txt_handle,
            sep=r"\s+",
            header=None,
            names=["TIME", "I", "LAT", "LONG", "PRES", "WND", "OWD"],
            nrows=int(header[2]),
            dtype={
                "I": np.int,
                "LAT": np.float32,
                "LONG": np.float32,
                "PRES": np.float32,
                "WND": np.float32,
                "OWD": np.float32,
            },
            parse_dates=True,
            date_parser=lambda x: pd.to_datetime(x, format=f"%Y%m%d%H"),
            index_col="TIME",
        )
        data_path["LAT"] = data_path["LAT"] / 10
        data_path["LONG"] = data_path["LONG"] / 10
        return header, data_path

head, dat = reader(r"/home/mw/project/CH2014BST(1).txt",'1409')

lat = dat.LAT
lon = dat.LONG
level = dat.I
pressure = dat.PRES

# 创建Figure
fig = plt.figure(figsize=(15, 12), dpi = 150)

# 绘制台风路径
ax2 = fig.add_subplot(1,2,2, projection=ccrs.PlateCarree())
ax2.set_extent([80,160,0,40])
ax2.coastlines()
ax2.add_feature(cfeat.LAND, alpha = 0.2)
ax2.add_feature(cfeat.OCEAN, alpha = 0.5)
ax2.set_xticks(np.arange(80,170,10), crs=ccrs.PlateCarree())
ax2.set_yticks(np.arange(0,50,10), crs=ccrs.PlateCarree())

lon_formatter = LongitudeFormatter()
lat_formatter = LatitudeFormatter()
ax2.xaxis.set_major_formatter(lon_formatter)
ax2.yaxis.set_major_formatter(lat_formatter)

points = np.array([lon, lat]).T.reshape(-1, 1, 2)
segments = np.concatenate([points[:-1], points[1:]], axis=1)

norm = plt.Normalize(1, 6)
colors = ['#FFFF00', '#6495ED', '#3CB371', '#FFA500','#FF00FF', '#DC143C']
cmap = plt.cm.colors.ListedColormap(colors)
lc = LineCollection(segments, cmap=cmap, norm=norm, transform=ccrs.PlateCarree())
lc.set_linewidth(0.5)
lc.set_array(level[:-1])
line = ax2.add_collection(lc)

# 创建图例
legend_elements = []
for i, color in enumerate(colors):
    legend_elements.append(Line2D([0], [0], marker=tcmarkers.TS,color=color, markersize=5))

# 添加图例到图表中
ax2.legend(legend_elements, ['Level 1', 'Level 2', 'Level 3', 'Level 4', 'Level 5', 'Level 6'], loc='lower left')

fig.colorbar(lc, ax=ax2, fraction=0.04)

for lon_i, lat_i, level in zip(lon, lat, level):
    if level == 1:
        color = colors[level-1]
    elif level == 2:
        color = colors[level-1]
    elif level == 3:
        color = colors[level-1]
    elif level == 4:
        color = colors[level-1]
    elif level == 5:
        color = colors[level-1]
    elif level == 6:
        color = colors[level-1]
    ax2.plot(lon_i, lat_i, marker=tcmarkers.TS, markersize=3, color=color)

plt.show()/opt/conda/lib/python3.7/site-packages/ipykernel_launcher.py:38: DeprecationWarning: `np.int` is a deprecated alias for the builtin `int`. To silence this warning, use `int` by itself. Doing this will not modify any behavior and is safe. When replacing `np.int`, you may wish to use e.g. `np.int64` or `np.int32` to specify the precision. If you wish to review your current use, check the release note link for additional information.
Deprecated in NumPy 1.20; for more details and guidance: https://numpy.org/devdocs/release/1.20.0-notes.html#deprecations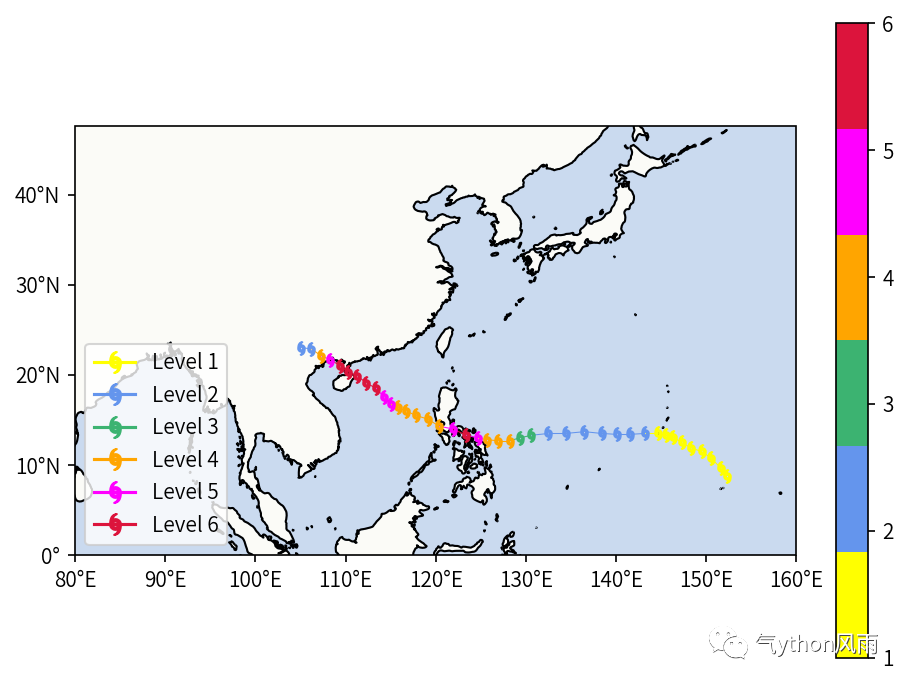
优化3.0
参考
https://www.heywhale.com/mw/project/5f48b64f5c4b5d00363819bd
替换背景图 增加台风变级时间及箭头
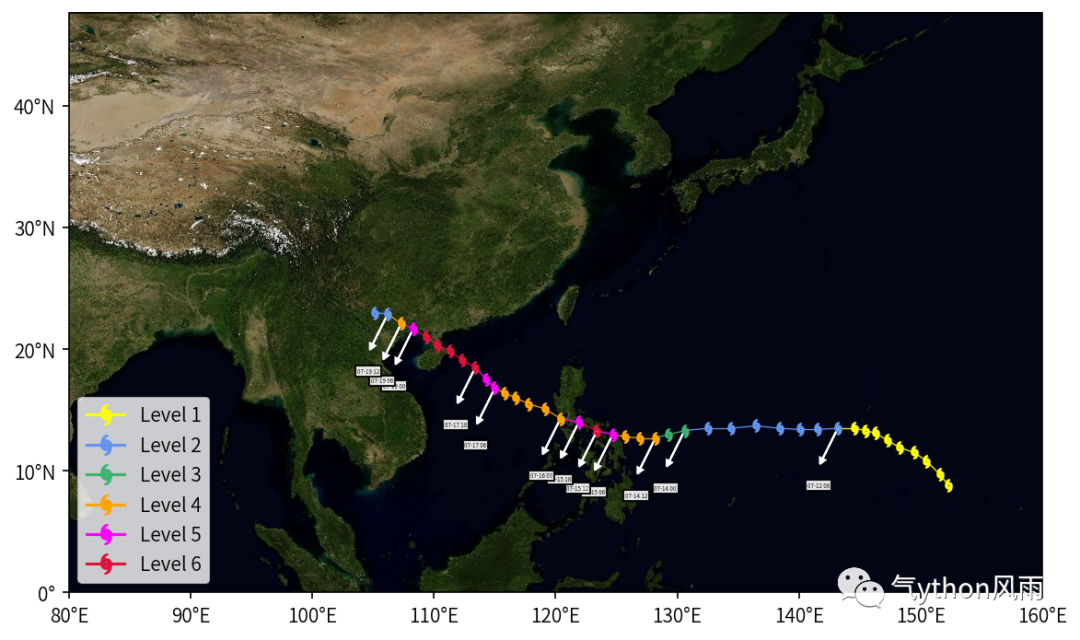
3.0版本的代码还请前往和鲸社区在线运行查看 重磅!Python台风路径还能这样画
本文参与 腾讯云自媒体同步曝光计划,分享自微信公众号。
原始发表:2024-01-01,如有侵权请联系 cloudcommunity@tencent.com 删除
评论
登录后参与评论
推荐阅读
目录
腾讯云开发者

Copyright © 2013 - 2026 Tencent Cloud. All Rights Reserved. 腾讯云 版权所有
深圳市腾讯计算机系统有限公司 ICP备案/许可证号:粤B2-20090059 ![]() 粤公网安备44030502008569号
粤公网安备44030502008569号
腾讯云计算(北京)有限责任公司 京ICP证150476号 | 京ICP备11018762号