
ggplot2:轴上的花括号?
在回答最近的可视化问题中,我确实需要大括号来显示一个轴上的跨度,而我不知道如何在ggplot2中实现它。情节如下:
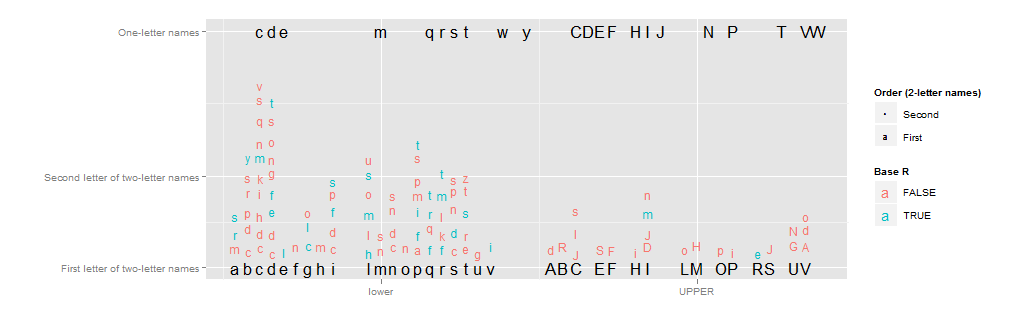
我真的希望y轴标签“两个字母名称的第二个字母”有一个从1到10的大括号(红色和蓝色的第二个字母的垂直跨度)。但我不知道该怎么做。X轴可以从类似的处理中受益。
代码可以在链接的CrossValidated问题中使用(对于本例来说,这是不必要的复杂,因此我不会展示它)。相反,下面是一个很小的例子:
library(ggplot2)
x <- c(runif(10),runif(10)+2)
y <- c(runif(10),runif(10)+2)
qplot(x=x,y=y) +
  scale_x_continuous("",breaks=c(.5,2.5),labels=c("Low types","High types") )
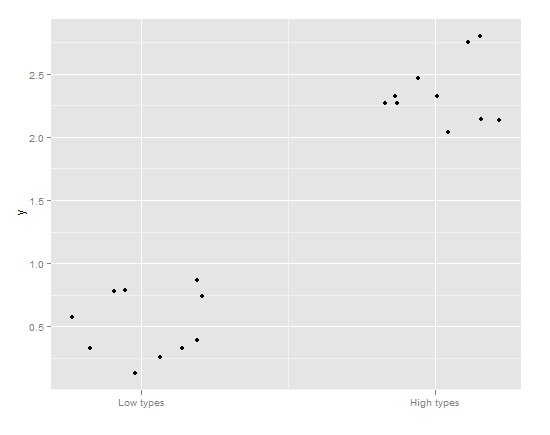
在这种情况下,从(0,1)到低类型的大括号和对于高类型的(2,3)的大括号将是理想的,而不是滴答符号。
我不想使用geom_rect,因为:
- 滴答的痕迹将保留下来
- 我更喜欢牙套
- 它将在情节里面而不是在外面。
我怎样才能做到这一点?最好的答案是:
- 漂亮的,光滑的,薄的卷曲支撑
- 绘制在绘图区域外
- 通过高级参数指定(理想情况下是传递给
scale_x_continuous中的scale_x_continuous选项的范围类型对象)
回答 6
Stack Overflow用户
发布于 2015-11-05 12:28:27
更新:如果需要使用ggsave()保存绘图并在保存的映像中保留方括号,一定会看到这个相关的堆栈溢出Q&A。
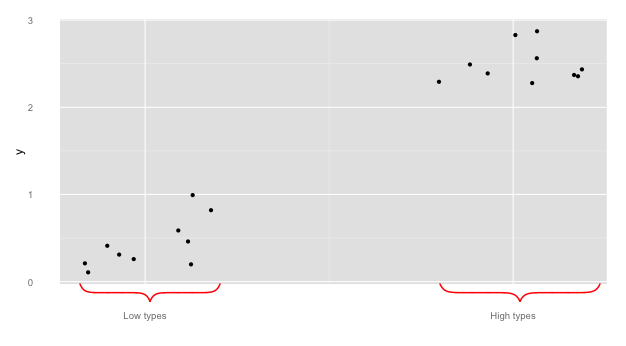
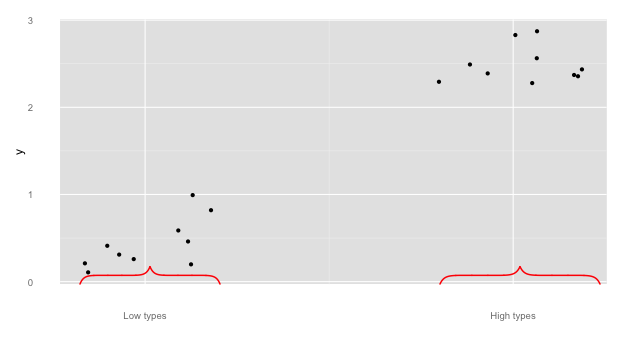
OP要求将括号从情节中删除。此解决方案使用axis.ticks.length与axis.ticks = element_blank()相结合,允许括号位于绘图区域之外。这个答案建立在@Pankil和@user697473的基础上:我们将使用pBrackets R包--并包括图片!
library(ggplot2)
library(grid)
library(pBrackets)
x <- c(runif(10),runif(10)+2)
y <- c(runif(10),runif(10)+2)
the_plot <- qplot(x=x,y=y) +
  scale_x_continuous("",breaks=c(.5,2.5),labels=c("Low types","High types") ) +
  theme(axis.ticks = element_blank(),
        axis.ticks.length = unit(.85, "cm"))


#Run grid.locator a few times to get coordinates for the outer
#most points of the bracket, making sure the
#bottom_y coordinate is just at the bottom of the gray area.
# to exit grid.locator hit esc; after setting coordinates
# in grid.bracket comment out grid.locator() line
the_plot
grid.locator(unit="native")
bottom_y <- 284
grid.brackets(220, bottom_y,   80, bottom_y, lwd=2, col="red")
grid.brackets(600, bottom_y,  440, bottom_y, lwd=2, col="red")
关于@Pankil的回答的一个简短的说明:
## Bracket coordinates depend on the size of the plot
## for instance,
## Pankil's suggested bracket coordinates do not work
## with the following sizing:
the_plot
grid.brackets(240, 440, 50, 440, lwd=2, col="red")
grid.brackets(570, 440, 381, 440, lwd=2, col="red")
## 440 seems to be off the graph...
还有几个来展示pBrackets的功能
#note, if you reverse the x1 and x2, the bracket flips:
the_plot
grid.brackets( 80, bottom_y, 220, bottom_y, lwd=2, col="red")
grid.brackets(440, bottom_y, 600, bottom_y, lwd=2, col="red")
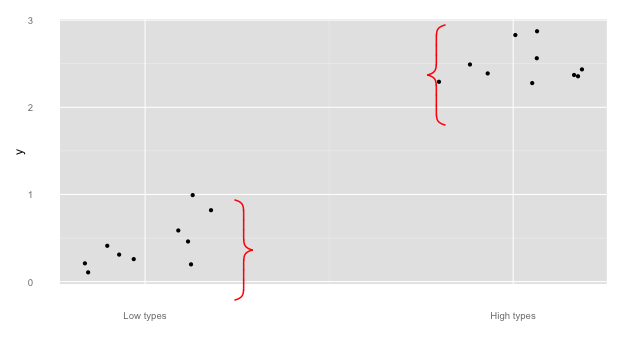
## go vertical:
the_plot
grid.brackets(235, 200, 235, 300, lwd=2, col="red")
grid.brackets(445, 125, 445,  25, lwd=2, col="red")
Stack Overflow用户
发布于 2011-08-10 17:25:26
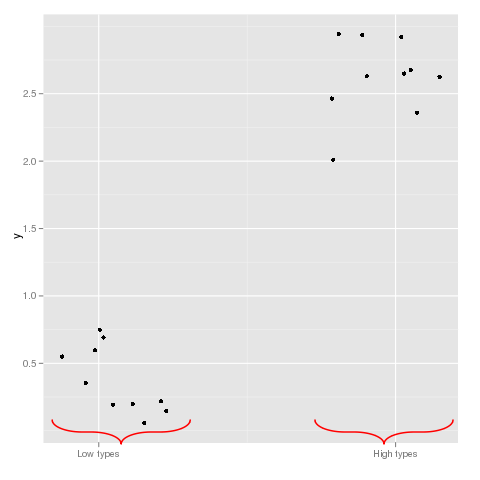
另一种使用绘制卷边括号的函数的解决方案。
谢谢古尔!
curly <- function(N = 100, Tilt = 1, Long = 2, scale = 0.1, xcent = 0.5,
                  ycent = 0.5, theta = 0, col = 1, lwd = 1, grid = FALSE){

# N determines how many points in each curve
# Tilt is the ratio between the axis in the ellipse
#  defining the curliness of each curve
# Long is the length of the straight line in the curly brackets
#  in units of the projection of the curly brackets in this dimension
# 2*scale is the absolute size of the projection of the curly brackets
#  in the y dimension (when theta=0)
# xcent is the location center of the x axis of the curly brackets
# ycent is the location center of the y axis of the curly brackets
# theta is the angle (in radians) of the curly brackets orientation
# col and lwd are passed to points/grid.lines

           ymin <- scale / Tilt
           y2 <- ymin * Long
           i <- seq(0, pi/2, length.out = N)

           x <- c(ymin * Tilt * (sin(i)-1),
                  seq(0,0, length.out = 2),
                  ymin * (Tilt * (1 - sin(rev(i)))),
                  ymin * (Tilt * (1 - sin(i))),
                  seq(0,0, length.out = 2),
                  ymin * Tilt * (sin(rev(i)) - 1))

           y <- c(-cos(i) * ymin,
                  c(0,y2),
                  y2 + (cos(rev(i))) * ymin,
                  y2 + (2 - cos(i)) * ymin,
                  c(y2 + 2 * ymin, 2 * y2 + 2 * ymin),
                  2 * y2 + 2 * ymin + cos(rev(i)) * ymin)

           x <- x + xcent
           y <- y + ycent - ymin - y2

           x1 <- cos(theta) * (x - xcent) - sin(theta) * (y - ycent) + xcent
           y1 <- cos(theta) * (y - ycent) + sin(theta) * (x - xcent) + ycent

           ##For grid library:
           if(grid){
              grid.lines(unit(x1,"npc"), unit(y1,"npc"),gp=gpar(col=col,lwd=lwd))
           }

           ##Uncomment for base graphics
           else{
              par(xpd=TRUE)
              points(x1,y1,type='l',col=col,lwd=lwd)
              par(xpd=FALSE)
           }

}


library(ggplot2)
x <- c(runif(10),runif(10)+2)
y <- c(runif(10),runif(10)+2)
qplot(x=x,y=y) +
  scale_x_continuous("",breaks=c(.5,2.5),labels=c("Low types","High types") )

curly(N=100,Tilt=0.4,Long=0.3,scale=0.025,xcent=0.2525,
      ycent=par()$usr[3]+0.1,theta=-pi/2,col="red",lwd=2,grid=TRUE)
curly(N=100,Tilt=0.4,Long=0.3,scale=0.025,xcent=0.8,
      ycent=par()$usr[3]+0.1,theta=-pi/2,col="red",lwd=2,grid=TRUE)
Stack Overflow用户
发布于 2011-08-09 21:00:44
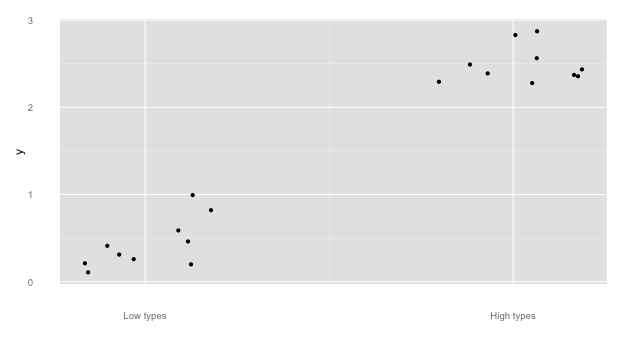
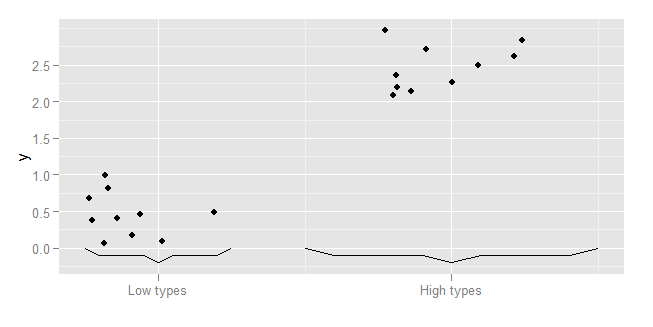
下面是ggplot中的一种简单的解决方案,它构造了一条线条图,它模糊地类似于一个卷曲括号。
构造一个函数,以卷曲括号的位置和尺寸作为输入。这个函数所做的是指定一个括号的大纲绘图的协调,并使用一些数学缩放,使它达到所需的大小和位置。您可以使用这一原则,并修改协调给您任何期望的形状。原则上,您可以使用相同的概念,并添加曲线,椭圆等。
bracket <- function(x, width, y, height){
  data.frame(
      x=(c(0,1,4,5,6,9,10)/10-0.5)*(width) + x,
      y=c(0,1,1,2,1,1,0)/2*(height) + y
  )
}把它传递给ggplot,特别是geom_line
qplot(x=x,y=y) +
    scale_x_continuous("",breaks=c(.5,2.5), labels=c("Low types","High types")) +
    geom_line(data=bracket(0.5,1,0,-0.2)) +
    geom_line(data=bracket(2.5,2,0,-0.2))
https://stackoverflow.com/questions/7001799
复制相似问题
腾讯云开发者

Copyright © 2013 - 2026 Tencent Cloud. All Rights Reserved. 腾讯云 版权所有
深圳市腾讯计算机系统有限公司 ICP备案/许可证号:粤B2-20090059 ![]() 粤公网安备44030502008569号
粤公网安备44030502008569号
腾讯云计算(北京)有限责任公司 京ICP证150476号 | 京ICP备11018762号