时间轴上滴答子集的数据格式
时间轴上滴答子集的数据格式
提问于 2014-07-04 00:12:24
问题
我想格式化我的X轴(时间),以便周末是清晰可见的.我想展示每周的日期和日期。
现状
我这样做是用(下面的完整代码)
scale_x_date(breaks=myData$timestamp,
  labels=paste(
    substr(format(myData$timestamp, "%a"),1,1),
    format(myData$timestamp, "%d"),
    sep="\n")
)
这给了我
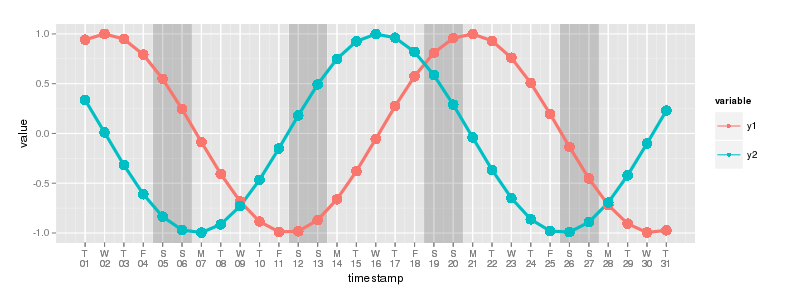
通缉情况
我宁愿平日用一个字母缩写,因为那里有点紧了。另外,我想把星期天(和假期)涂成红色。我的意思是(用GIMP做的)。注意第一个星期一和上个星期五是如何通过
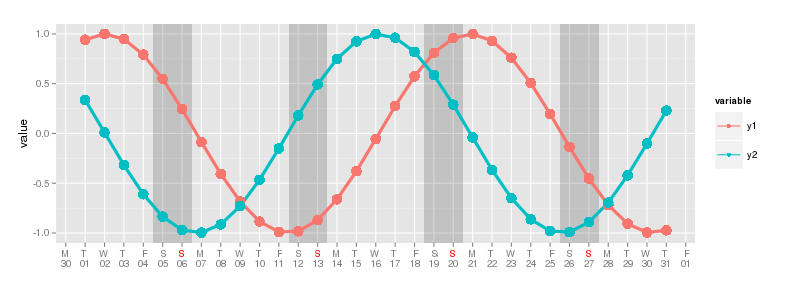
scale_x_date(breaks = "1 day",
  minor_breaks = "1 days",
  labels = date_format("%a\n%d"),
  name="")
然而,我得到了工作日的三个字母缩写,这是我在GIMP中删除的。
下面是这个示例的完整代码。
library(ggplot2)
library(scales)
library(reshape2)

minimumTime <- as.Date("2014-07-01")
maximumTime <- as.Date("2014-07-31")

x <- seq(minimumTime,maximumTime, by="1 day")
y1 <- sin(as.numeric(x)/3)
y2 <- cos(as.numeric(x)/3)

myData <- data.frame(timestamp=x, y1=y1, y2=y2)
myData <- melt(myData, id.vars="timestamp")

rects <- data.frame(saturdays=myData[weekdays(myData$timestamp) == "Saturday","timestamp"]-0.5, sundays = myData[weekdays(myData$timestamp) == "Saturday","timestamp"]+1.5)

myPlot <- ggplot() +
    geom_rect(data=rects, aes(xmin=saturdays, xmax=sundays,ymin=-Inf, ymax=Inf), alpha=0.1) +
    geom_line(data=myData, aes(x=timestamp, y=value, colour=variable,size=1)) +
    geom_point(data=myData, aes(x=timestamp, y=value, colour=variable,size=2)) +
    scale_x_date(breaks=myData$timestamp, labels=paste(substr(format(myData$timestamp, "%a"),1,1),format(myData$timestamp, "%d"),sep="\n")) +
    #scale_x_date(breaks = "1 day", minor_breaks = "1 days", labels = date_format("%a\n%d"), name="")  +
    scale_size_continuous(range = c(1.5,5), guide=FALSE)
所以总结一下:
- 是否有办法在另一种颜色中对特定的断点进行着色?
- 在这种情况下,是否有办法手动更改标签,并在星期一和星期五开始和结束时使用?
- 另外,如果有一种方法可以让每个标签的线条以中心为中心,那就太棒了:)
谢谢!
回答 1
Stack Overflow用户
回答已采纳
发布于 2014-07-04 00:21:41
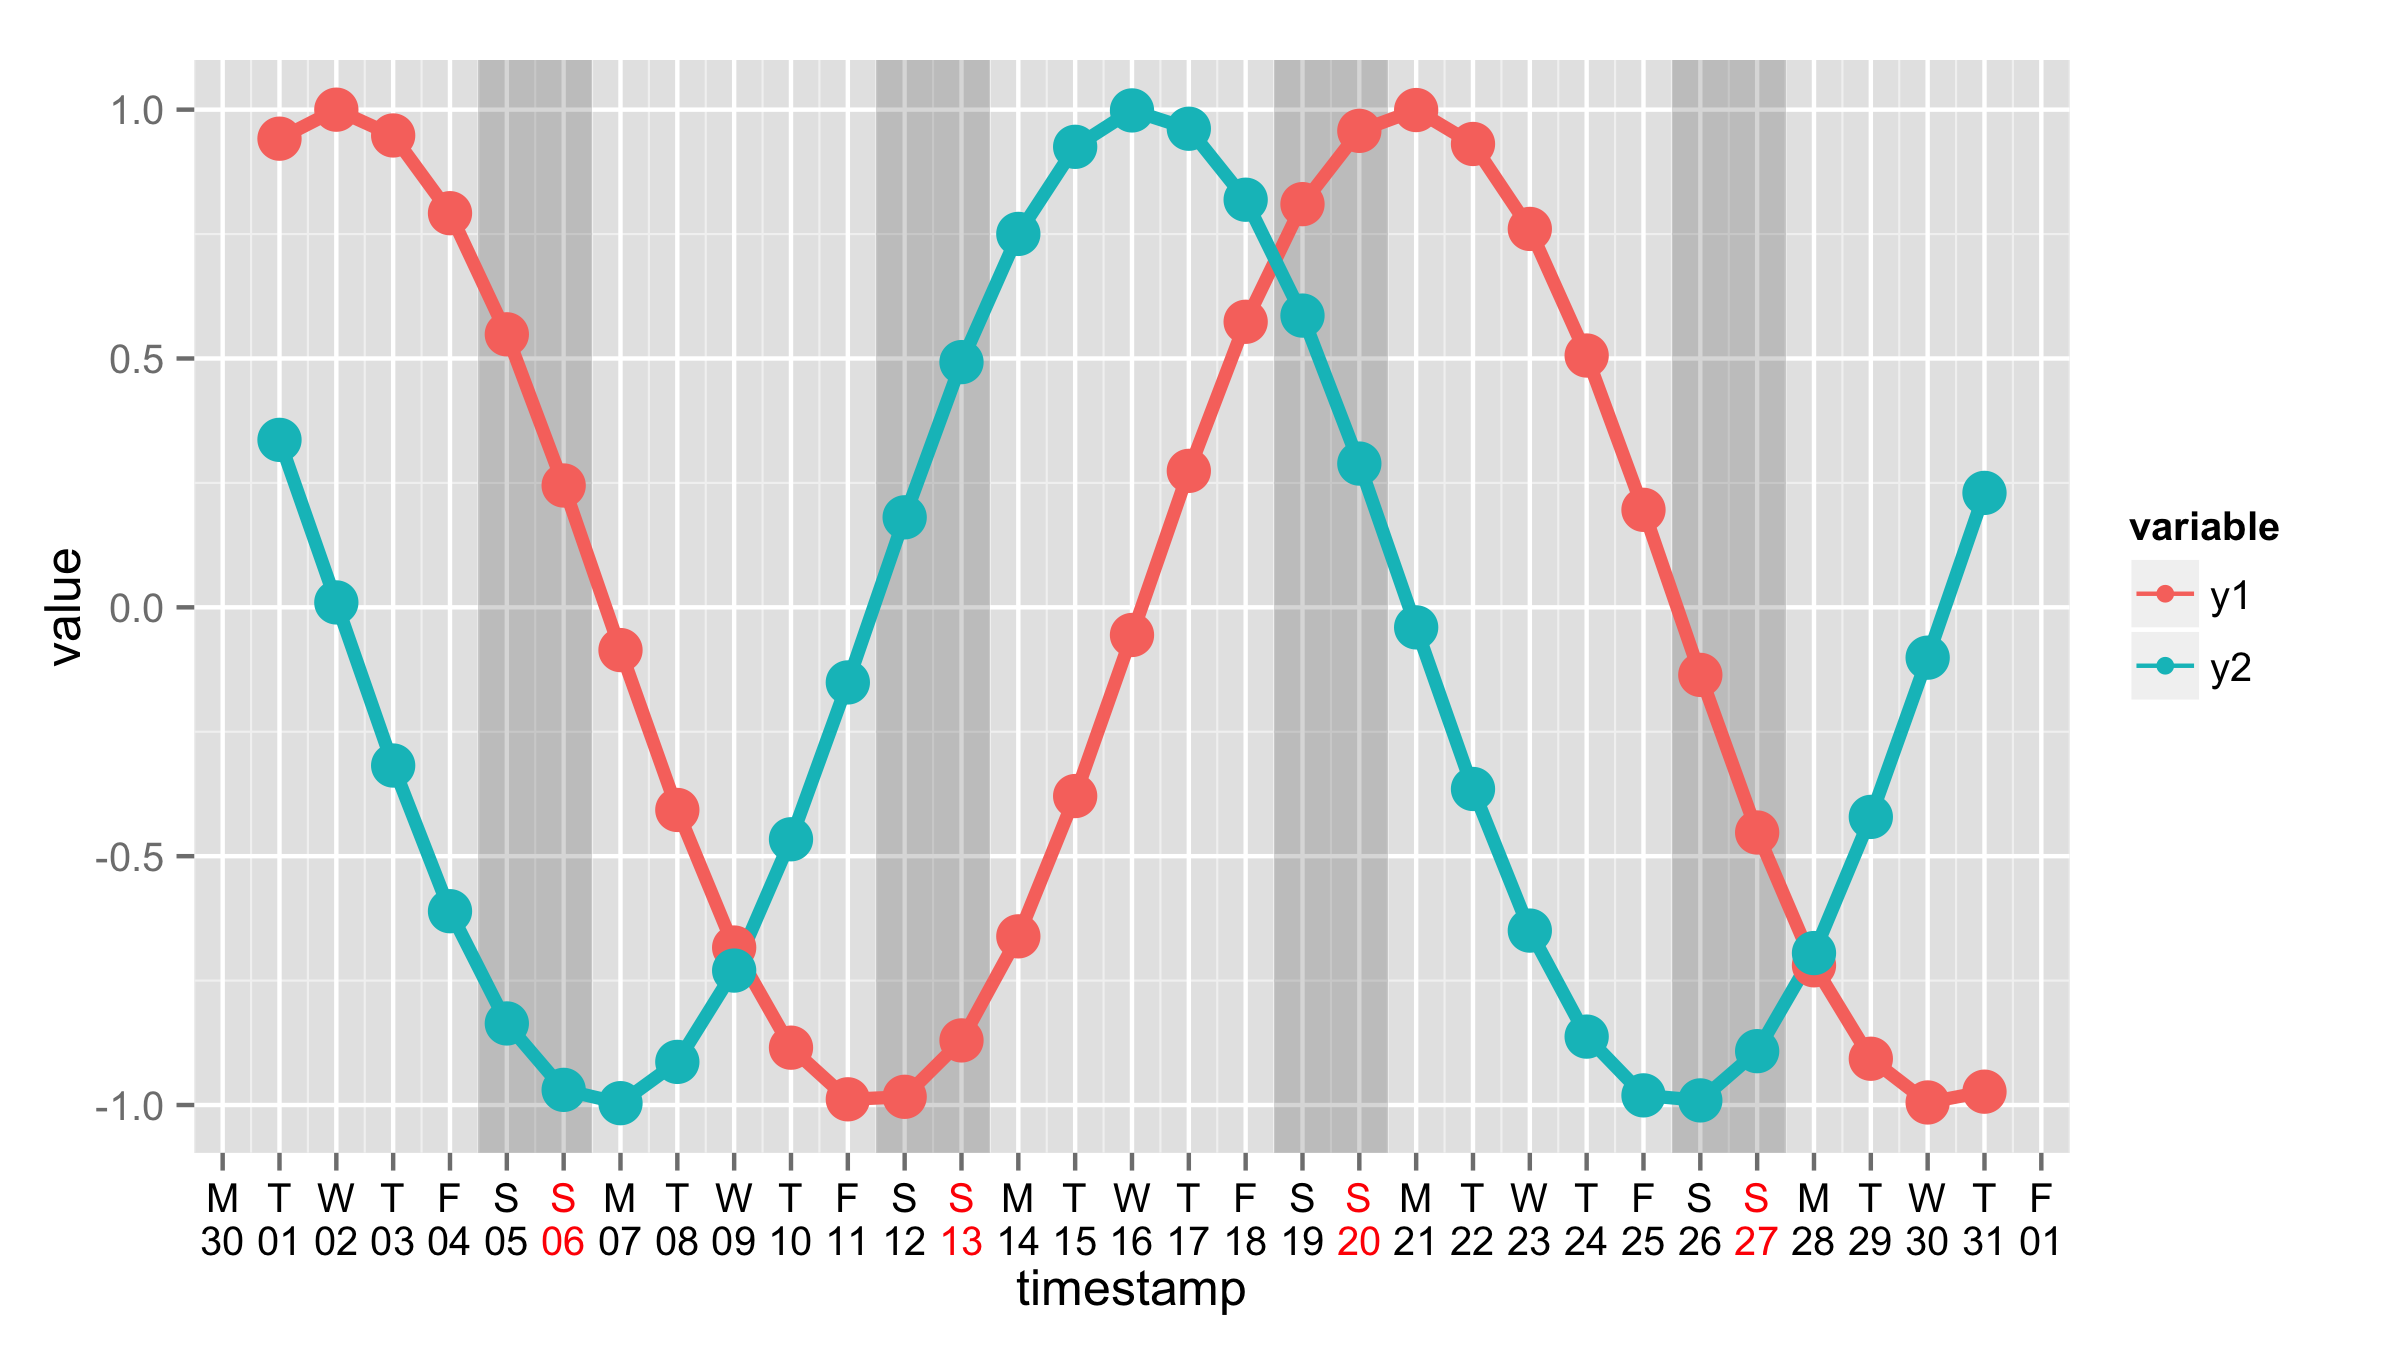
您可以对标签使用自定义格式化程序,也可以使用breaks="1 day"参数,只需在labels=和replace myDate$timestamp之后使用x。这也将解决第三个问题。
 + scale_x_date(breaks="1 day",
labels= function(x) paste(substr(format(x, "%a"),1,1),format(x, "%d"),sep="\n")) 或者,您可以将转换作为单独的函数,然后将其用于labels=。
my_date_trans<-function(x) {
      paste(substr(format(x, "%a"),1,1),format(x, "%d"),sep="\n")
}

+ scale_x_date(breaks="1 day",labels=my_date_trans)若要更改标签的颜色,应使用theme()和axis.text.x=。这里我使用的颜色矢量,包含6倍黑色,然后红色,因为你的比例尺从星期一开始。然后,这些颜色被重复。
ggplot() +
      geom_rect(data=rects, aes(xmin=saturdays, xmax=sundays,ymin=-Inf, ymax=Inf), alpha=0.1) +
      geom_line(data=myData, aes(x=timestamp, y=value, colour=variable,size=1)) +
      geom_point(data=myData, aes(x=timestamp, y=value, colour=variable,size=2)) +
      scale_x_date(breaks="1 day",labels=my_date_trans)+
      scale_size_continuous(range = c(1.5,5), guide=FALSE)+
      theme(axis.text.x=element_text(color=c(rep("black",6),"red")))
页面原文内容由Stack Overflow提供。腾讯云小微IT领域专用引擎提供翻译支持
原文链接:
https://stackoverflow.com/questions/24569628
复制相关文章
相似问题
腾讯云开发者
