ChartControl控件绘制柱状图


1、新建一个DevExpress窗体(不要用WinForm窗体)
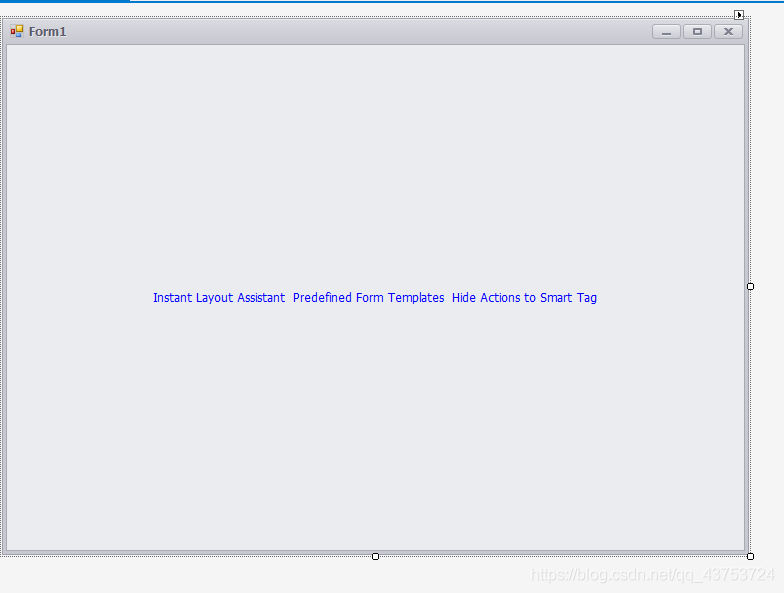
2、拖入一个chartcontrol控件
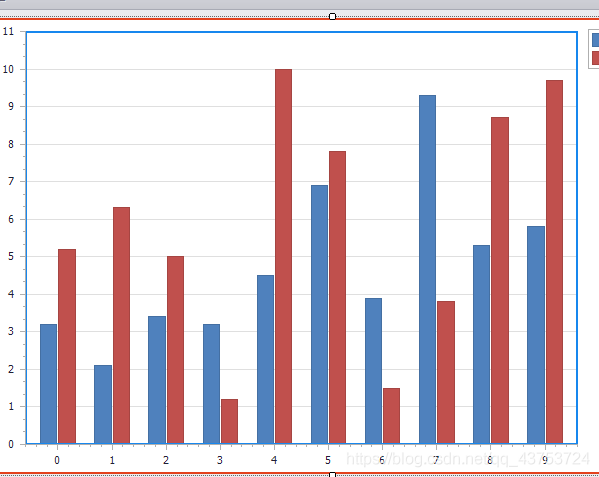
3、鼠标右键,点击run designer
添加两个series
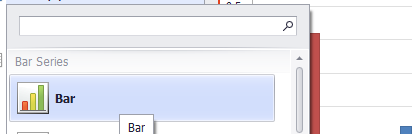
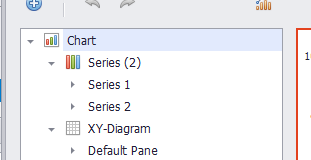
4、代码设置
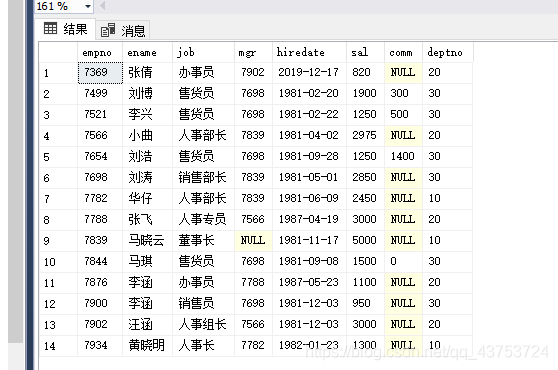
- 数据库表结构,我的想法是统计办事员和售货员的人数
- 数据库查询语句
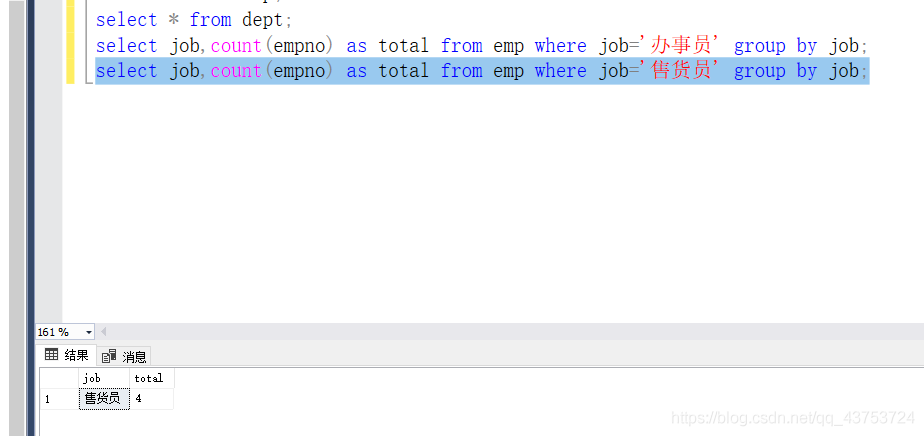
select job,count(empno) as total from emp where job='办事员' group by job;
select job,count(empno) as total from emp where job='售货员' group by job;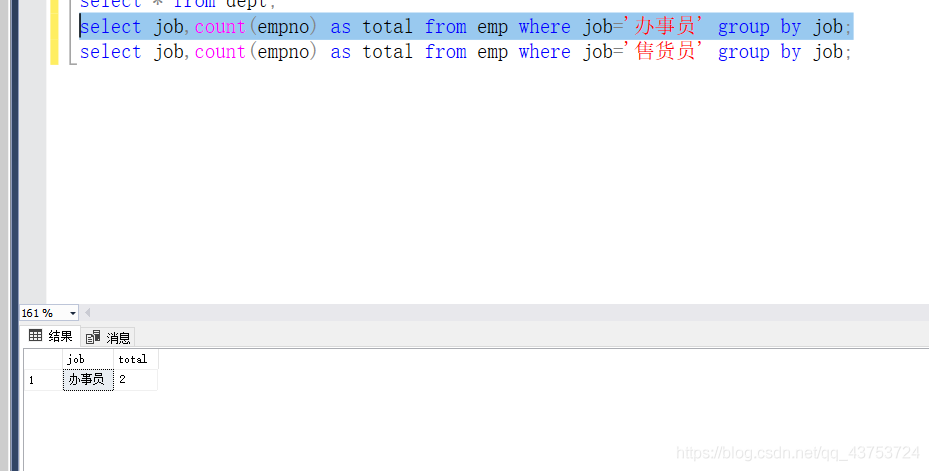
Form1.cs代码设置:
using DevExpress.XtraCharts;
using System;
using System.Collections.Generic;
using System.ComponentModel;
using System.Data;
using System.Data.SqlClient;
using System.Drawing;
using System.Linq;
using System.Text;
using System.Windows.Forms;

namespace DXApplication9
{
    public partial class Form1 : DevExpress.XtraEditors.XtraForm
    {
        public Form1()
        {
            InitializeComponent();
            Bind();
        }
        public void Bind()
        {
            //Series类就是向图标里填充数据的类
            Series s1 = this.chartControl1.Series[0];
            Series s2 = this.chartControl1.Series[1];
            using (SqlConnection con=new SqlConnection("Data Source=.;Initial Catalog=test_10_23;User ID=sa;Password=123456;Connection Timeout=10"))
            {
                string sql = "select job,count(empno) as total from emp where job='办事员' group by job;";
                string sql1 = "select job,count(empno) as total from emp where job='售货员' group by job;";
                SqlDataAdapter sda=new SqlDataAdapter(sql,con);
                SqlDataAdapter sda1 = new SqlDataAdapter(sql1, con);
                DataSet ds = new DataSet();
                DataSet ds1 = new DataSet();
                sda.Fill(ds);
                sda1.Fill(ds1);
                s1.DataSource = ds.Tables[0];
                s2.DataSource = ds1.Tables[0];
                s1.ArgumentDataMember = "job";//横坐标
                s2.ArgumentDataMember = "job";
                s1.ValueDataMembers[0] = "total";//纵坐标
                s2.ValueDataMembers[0] = "total";
                s1.LegendText = "办事员";
                s2.LegendText = "售货员";
            }

        }
    }
}
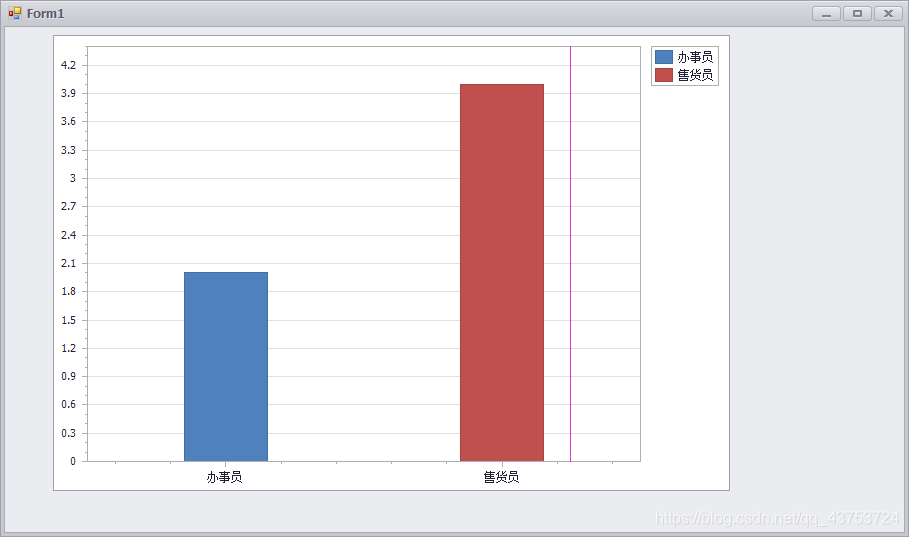
5、启动程序
本文参与 腾讯云自媒体同步曝光计划,分享自作者个人站点/博客。
原始发表:2020-11-01,如有侵权请联系 cloudcommunity@tencent.com 删除
目录
腾讯云开发者
Copyright © 2013 - 2026 Tencent Cloud. All Rights Reserved. 腾讯云 版权所有
深圳市腾讯计算机系统有限公司 ICP备案/许可证号:粤B2-20090059  粤公网安备44030502008569号
腾讯云计算(北京)有限责任公司 京ICP证150476号 | 京ICP备11018762号