Power BI DAX自定义层级分解树


Power BI内置的分解树不能够满足使用需求,因此我尝试使用DAX自定义几种树形/分解类图表,今天分享一个基础版。
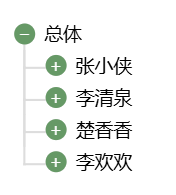
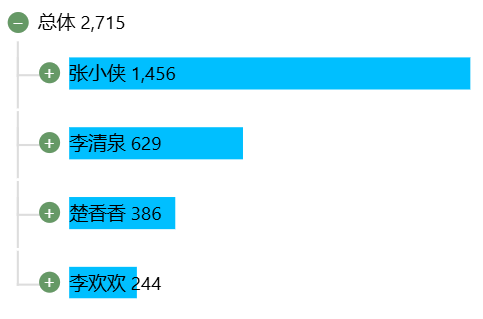
下图展示了某连锁零售店的四位负责人:
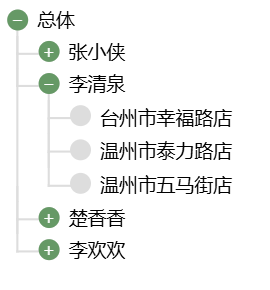
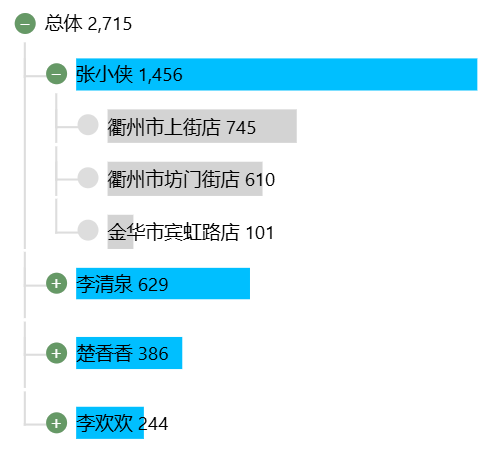
点击加号可以展开人物负责的店铺:
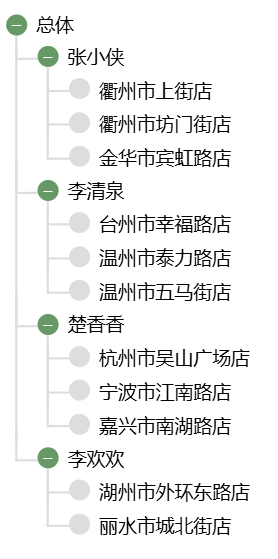
可以单个展开,也可以全部展开:
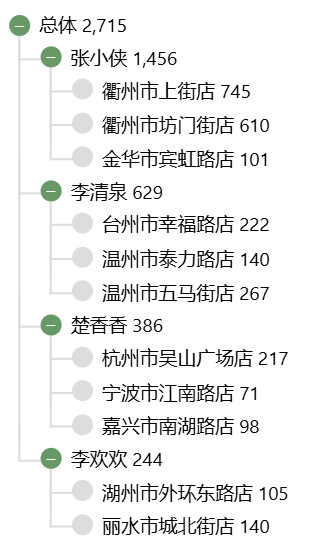
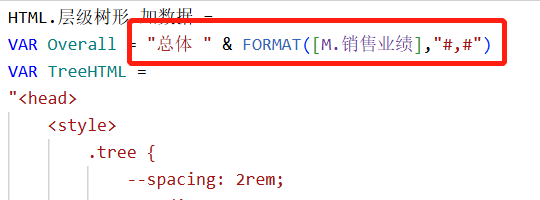
可以加数据:
可以加图表:
图表层级展开:
实现原理是DAX+HTML+CSS,把以下度量值放入HTML Content视觉对象展示:
HTML.层级树形.基础 =
VAR Overall = "总体"
VAR TreeHTML =
"<head>
    <style>
        .tree {
            --spacing: 2rem;
            --radius: 10px;
            font-size: 1.2rem;
            line-height: 1.8;
        }
        .tree li {
            display: block;
            position: relative;
            padding-left: calc(2 * var(--spacing) - var(--radius) - 2px);
            font-size: 1.2rem;
            line-height: 1.8;
        }
        .tree ul {
            margin-left: calc(var(--radius) - var(--spacing));
            padding-left: 0;
        }
        .tree ul li {
            border-left: 2px solid #ddd;
        }
        .tree ul li:last-child {
            border-color: transparent;
        }
        .tree ul li::before {
            content: '';
            display: block;
            position: absolute;
            top: calc(var(--spacing) / -2);
            left: -2px;
            width: calc(var(--spacing) + 2px);
            height: calc(var(--spacing) + 1px);
            border: solid #ddd;
            border-width: 0 0 2px 2px;
        }
        .tree summary {
            display: block;
            cursor: pointer;
            font-size: 1.2rem;
            line-height: 1.7;
        }
        .tree summary::marker,
        .tree summary::-webkit-details-marker {
            display: none;
        }
        .tree summary:focus {
            outline: none;
        }
        .tree summary:focus-visible {
            outline: 1px dotted #000;
        }
        .tree li::after,
        .tree summary::before {
            content: '';
            display: block;
            position: absolute;
            top: calc(var(--spacing) / 2 - var(--radius));
            left: calc(var(--spacing) - var(--radius) - 1px);
            width: calc(2 * var(--radius));
            height: calc(2 * var(--radius));
            border-radius: 50%;
            background: #ddd;
        }
        .tree summary::before {
            content: '+';
            z-index: 1;
            background: #696;
            color: #fff;
            line-height: calc(2 * var(--radius) - 2px);
            text-align: center;
        }
        .tree details[open] > summary::before {
            content: '−';
        }
    </style>
</head>
<body>
    <ul class='tree'>
        <li>
            <details open>
                <summary>" & Overall & "</summary>
                <ul>"
VAR CatHTML =
    CONCATENATEX(
        VALUES('店铺资料'[督导]),
        VAR Cat = [督导]
        RETURN
        "<li>
            <details>
                <summary>" & [督导] & "</summary>
                <ul>"
                & CONCATENATEX(
                    FILTER('店铺资料', '店铺资料'[督导] = Cat),
                    "<li>" & [店铺名称] & "</li>",
                    ""
                ) &
                "</ul>
            </details>
        </li>",
        ""
    )
VAR FinalHTML =
    TreeHTML & CatHTML & "</ul>
            </details>
        </li>
    </ul>
</body>
</html>"
--公众号:wujunmin
RETURN FinalHTML度量值中的“总体”字样以及维度按需修改,示例是两层维度,如果有更多层级可以让DeepSeek帮忙改代码(类似案例:基于DeepSeek的Power BI可视化优化:释放图表资源新潜能)。
如需在图表中添加数据,Format串联:
如需添加条形图,把HTML条形图代码放入summary:Power BI 一行度量值绘制条形图
配套pbix在文末知识星球提供。
参考文献:
https://segmentfault.com/a/1190000043966941
本文参与 腾讯云自媒体同步曝光计划,分享自微信公众号。
原始发表:2025-03-14,如有侵权请联系 cloudcommunity@tencent.com 删除
评论
登录后参与评论
推荐阅读
腾讯云开发者

Copyright © 2013 - 2026 Tencent Cloud. All Rights Reserved. 腾讯云 版权所有
深圳市腾讯计算机系统有限公司 ICP备案/许可证号:粤B2-20090059 ![]() 粤公网安备44030502008569号
粤公网安备44030502008569号
腾讯云计算(北京)有限责任公司 京ICP证150476号 | 京ICP备11018762号