
在R中为未命名变量创建标签列
提问于 2021-03-15 15:37:32
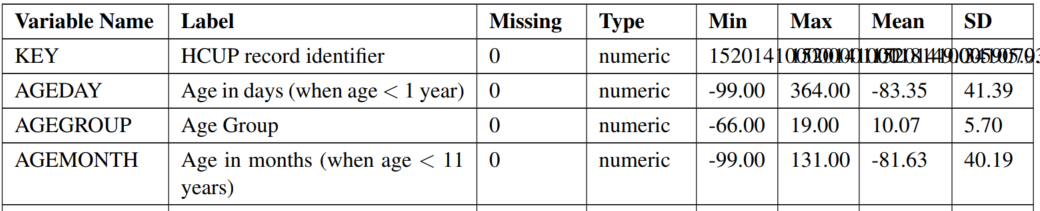
我想要创建一个名为Label的列,以便在我的汇总统计信息中显示。例如,如下表所示。
假设我有这样的数据:
df <- data.frame(age_years = c(33, 11, 45, 67, 8, 99), sex = factor(c(0, 1, 1, 0, 0, 0)))

> df

      age_years       sex
    1          33          0
    2          11          1
    3          45          1
    4          67          0
    5          8           0
6 99 0我试过使用Hmisc包。
library(Hmisc)

var.labels = c(age_years="Age in Years", sex="Sex")

label(df) = as.list(var.labels[match(names(df), names(var.labels))])
对于汇总表,我使用了以下代码:
Variables <- names(df)
Label <- label(df)
Missing <- sapply(df, function(x) sum(is.na(x)))
Type <- sapply(df, function(x) class(x))
Min <- sapply(df, function(x) min(x, na.rm = TRUE))
Max <- sapply(df, function(x) max(x, na.rm = TRUE))
SD <- sapply(df, function(x) format(round(sd(x, na.rm=TRUE), 2), nsmall = 2))
Mean <- sapply(df, function(x) format(round(mean(x, na.rm=TRUE), 2), nsmall = 2))
#To get the Latex table for the rows
knitr::kable(as.data.frame(cbind(Variables, Label, Missing, Type, Min, Max, Mean, SD), row.names = FALSE), "latex")
我不会得到一个列名为“标签”与上述代码。我希望在汇总统计表的标签列中将变量age_years标记为“年中的年龄”,而性别变量的标签列则是相同的。我的乳胶输出来自R。
   \begin{tabular}{l|l|l|l|l|l|l|l}
\hline
Variables & Missing & age\_years & sex & Min & Max & Mean & SD\\
\hline
age\_years & 0 & labelled & labelled & 0 & 104 & 54.94 & 20.06\\
\hline
sex & 0 & numeric & numeric & 1 & 2 & 1.46 & 0.50\\
\hline
\end{tabular}
我的乳胶桌看起来不像上面的那张:
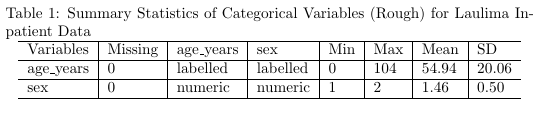
我不知道为什么age_years和性别作为专栏出现。我想去掉这些变量列。
我认为代码Label <- label(df)的这一部分有问题

回答 1
Stack Overflow用户
回答已采纳
发布于 2021-03-15 20:03:11
在一个class中可以有多个值,例如,请参阅:
class(df$age_years)
#[1] "labelled" "numeric"
将类合并成一个逗号分隔的字符串。
toString(class(df$age_years))
#[1] "labelled, numeric"或者,如果要选择第二个类(“数值”),可以使用if条件。
if(length(class(df$age_years) > 1)) class(df$age_years)[2] else class(df$age_years)[1]
#[1] "numeric"使用if方法完成代码-
df <- Filter(is.numeric, df)
Variables <- names(df)
Label <- label(df)
Missing <- sapply(df, function(x) sum(is.na(x)))
Type <- sapply(df, function(x) {tmp <- class(x);if(length(x) > 1) tmp[2] else tmp[1]})
Min <- sapply(df, function(x) min(x, na.rm = TRUE))
Max <- sapply(df, function(x) max(x, na.rm = TRUE))
SD <- sapply(df, function(x) format(round(sd(x, na.rm=TRUE), 2), nsmall = 2))
Mean <- sapply(df, function(x) format(round(mean(x, na.rm=TRUE), 2), nsmall = 2))
#To get the Latex table for the rows
knitr::kable(data.frame(Variables, Label, Missing, Type, Min, Max, Mean, SD, row.names = NULL))

|Variables |Label        | Missing|Type    | Min| Max|Mean  |SD    |
|:---------|:------------|-------:|:-------|---:|---:|:-----|:-----|
|age_years |Age in Years | 0|numeric | 8| 99|43.83 |34.82 |页面原文内容由Stack Overflow提供。腾讯云小微IT领域专用引擎提供翻译支持
原文链接:
https://stackoverflow.com/questions/66647156
复制相关文章

![Android获取屏幕分辨率及DisplayMetrics简介[通俗易懂]](https://ask.qcloudimg.com/http-save/yehe-8223537/7556c67864b3a3bb3a1c30d1cd4227b8.gif)


点击加载更多


腾讯云开发者

