
其中/当解释器生成图形输出时,海运对matplotlib
我的问题是如何将海运和matplotlib结合使用,这在许多作品中是常见的做法。
我不明白到底是什么命令生成图形输出..。
Python解释器如何知道何时绘制图形?
我以前认为sns正在绘制图形,因为它将是图形输出之前的最后一个命令:
plt.title("Monthly Visitors to Avila Adobe")
plt.xlabel("Date")

sns.lineplot(data=museum_data['Avila Adobe'],label='Avila Adobe')但是,我发现了其他一些例子,包括反向调用、最后的plt,以及仅在plt调用之后才显示的图形输出:
sns.lineplot(data=museum_data['Avila Adobe'],label='Avila Adobe')

plt.title("Monthly Visitors to Avila Adobe")
plt.xlabel("Date")
上面的两个代码确实是相同的图形。
我知道海运是建立在matplotlib之上的。
但,
我不明白代码在哪里/什么时候生成图形输出:在sns之后还是在plt之后
什么样的语句可以画出图表?
如果我的合理化是错误的,请说明原因。
回答 1
Stack Overflow用户
发布于 2021-02-03 20:08:24
Seaborn和Matplotlib是两个Python's最强大的可视化库。Seaborn使用更少的语法,并且具有惊人的默认主题,而且通过访问类,Matplotlib更容易定制。
Seaborn
海航软件包是在Matplotlib库的基础上开发的。它被用来创建更具吸引力和信息丰富的统计图形。虽然seaborn是一个不同的包,但它也可以用来开发matplotlib图形的吸引力。
为了回答您的问题,当我们将seaborn加载到会话中时,每次执行matplotlib绘图时,都会添加seaborn's默认自定义。然而,困扰许多用户的一个巨大问题是titles可能会重叠。将其与matplotlib's结合起来,只会混淆其标题的命名约定,就会带来麻烦。尽管如此,attractive visuals仍然使它适用于每一个数据科学家的工作。
为了得到我们想要的时尚标题和更多的可定制性,我们需要使用seaborn & matplotlib结构。请注意,这是必要的,只有当我们使用字幕在我们的情节。有时他们是必要的,所以最好是手头有它。有关详细信息,请参阅下面的代码。
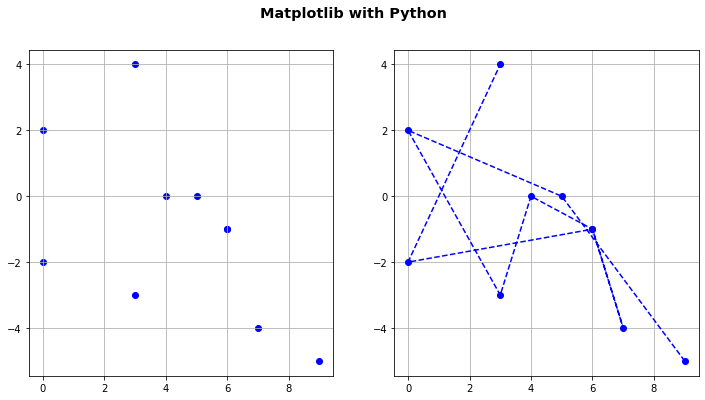
matplotlib 风格情节:
import matplotlib.pyplot as plt
import numpy as np

# using some dummy data for this example
xs = np.random.randint( 0, 10, size=10)
ys = np.random.randint(-5, 5,  size=10)

# plot the points
fig = plt.figure(figsize=(12,6))
fig.suptitle('Matplotlib with Python', fontsize='x-large', fontweight='bold')
plt.subplot(121)
plt.scatter(xs,ys,c='b') # scatter graph plotted from this line
plt.grid()
plt.subplot(122)
plt.plot(xs,ys,'bo--') # line graph plotted from this line
plt.grid()
Seaborn 风格情节:
import seaborn as sns
sns.set()

fig = plt.figure()
fig.suptitle('Seaborn with Python', fontsize='x-large', fontweight='bold')
fig.subplots_adjust(top=0.87)
#This is used for the main title. 'figure()' is a class that provides all the plotting elements of a diagram.
#This must be used first or else the title will not show.fig.subplots_adjust(top=0.85) solves our overlapping title problem.

fig = plt.figure(figsize=(12,6))
ax = fig.add_subplot(121)

fontdict={'fontsize': 14,
        'fontweight' : 'book',
        'verticalalignment': 'baseline',
        'horizontalalignment': 'center'}

ax.set_title('Scatter Plot Tutorial', fontdict=fontdict)
#This specifies which plot to add the customizations. fig.add_sublpot(121) corresponds to top left plot no.1


plt.plot(xs, ys, 'bo' ) # scatter graph plotted from this line in seaborn with matplotlib command & seaborn style
plt.xlabel('x-axis', fontsize=14)
plt.ylabel('yaxis', fontsize=14)

ax = fig.add_subplot(122)
fontdict={'fontsize': 14,
        'fontweight' : 'book',
        'verticalalignment': 'baseline',
        'horizontalalignment': 'center'}

ax.set_title('Line Plot Tutorial', fontdict=fontdict)
sns.lineplot(xs, ys) # line graph plotted from this line in seaborn with seaborn command & seaborn style
plt.xlabel('x-axis', fontsize=14)
plt.ylabel('yaxis', fontsize=14);
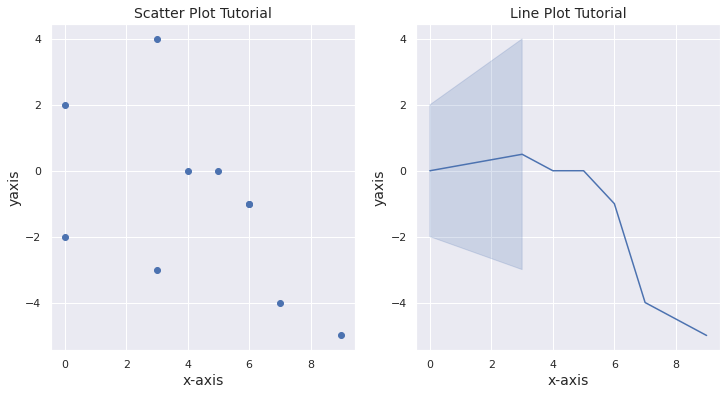
现在比较这两个情节stylewise,并请仔细阅读代码stylewise。
源
https://stackoverflow.com/questions/66039087
复制


相似问题
NCover、TypeMock和MSTest
NCover覆盖率报告如何处理MSTest访问器?
如何集成NCover和MSTest 10.0?
如何使用CruiseControl配置MStest
使用NCover附加模块的NCover Nunit CruiseControl.NET任务
领取专属 10元无门槛券
AI混元助手 在线答疑

洞察 腾讯核心技术
剖析业界实践案例

腾讯云开发者

