GEE数据集——1988—2012年DEA (Digital Earth Australia )澳大利亚数字地球项目几何中值和绝对偏差中值 - Landsat 5 3.1.0(25m分辨率)

GEE数据集——1988—2012年DEA (Digital Earth Australia )澳大利亚数字地球项目几何中值和绝对偏差中值 - Landsat 5 3.1.0(25m分辨率)

此星光明
发布于 2024-04-04 11:15:24
发布于 2024-04-04 11:15:24
简介
该产品提供统计工具,用于利用澳大利亚数字地球中的 Landsat 5 数据时间序列,提供总体状况的年度图像,以及特定年份某一地区的变化程度。
该产品的大地测量部分提供特定年份的 "平均 "无云图像。地磁图像采用多维中值计算,同时使用卫星图像的所有光谱测量值,以保持测量值之间的关系。
该产品的绝对偏差中值部分使用了三种方差测量方法,每种方法都提供了给定年份的 "二阶 "高维统计综合结果。根据亮度和光谱等因素,这三个方差测量值显示了一个区域与 "平均值 "在 "距离 "上的差异程度:
欧氏距离 (EMAD) 余弦(光谱)距离 (SMAD) 布雷-柯蒂斯相似度 (BCMAD) 它们共同提供了特定年份的景观差异信息,对变化检测应用非常有用。
如需了解更多信息,请参阅 DEA 几何中值和中值绝对偏差大地遥感卫星。
该产品是澳大利亚数字地球计划的一部分
Digital Earth Australia Home | Digital Earth Australia | Geoscience Australia
数据介绍
Catalog Owner
Geoscience Australia
Dataset Availability
1998-01-01T00:00:00Z–2012-01-01T00:00:00Z
Dataset Provider
Contact
https://www.ga.gov.au/contact-us
Earth Engine Snippet
ee.ImageCollection("projects/geoscience-aus-cat/assets/ga_ls5t_nbart_gm_cyear_3")
Resolution 25 meters
波段
Name | Min | Max | Wavelength | Description |
|---|---|---|---|---|
blue | 0* | 10000* | 0.450-0.520 μm | Band blue surface reflectance geometric median. |
green | 0* | 10000* | 0.520-0.600 μm | Band green surface reflectance geometric median. |
red | 0* | 10000* | 0.630-0.690 μm | Band red surface reflectance geometric median. |
near_infrared | 0* | 10000* | 0.760-0.900 μm | Band near infrared surface reflectance geometric median. |
shortwave_infrared_1 | 0* | 10000* | 1.550-1.750 μm | Band shortwave infrared 1 surface reflectance geometric median. |
shortwave_infrared_2 | 0* | 10000* | 2.080-2.350 μm | Band shortwave infrared 2 surface reflectance geometric median. |
Euclidean_distance_median_absolute_deviation | 0* | 10000* | The Median Absolute Deviation using Euclidean distance (EMAD). EMAD is more sensitive to changes in target brightness. | |
spectral_distance_median_absolute_deviation | 0* | 10000* | The Median Absolute Deviation using Cosine (spectral) distance (SMAD). SMAD is more sensitive to change in target spectral response. | |
Bray_Curtis_dissimilarity_median_absolute_deviation | 0* | 10000* | The Median Absolute Deviation using Bray Curtis dissimilarity (BCMAD). BCMAD is more sensitive to the distribution of the observation values through time. | |
count | 0* | 400* | The number of the available pixels used for calculation per calendar year. |
* estimated min or max value
代码
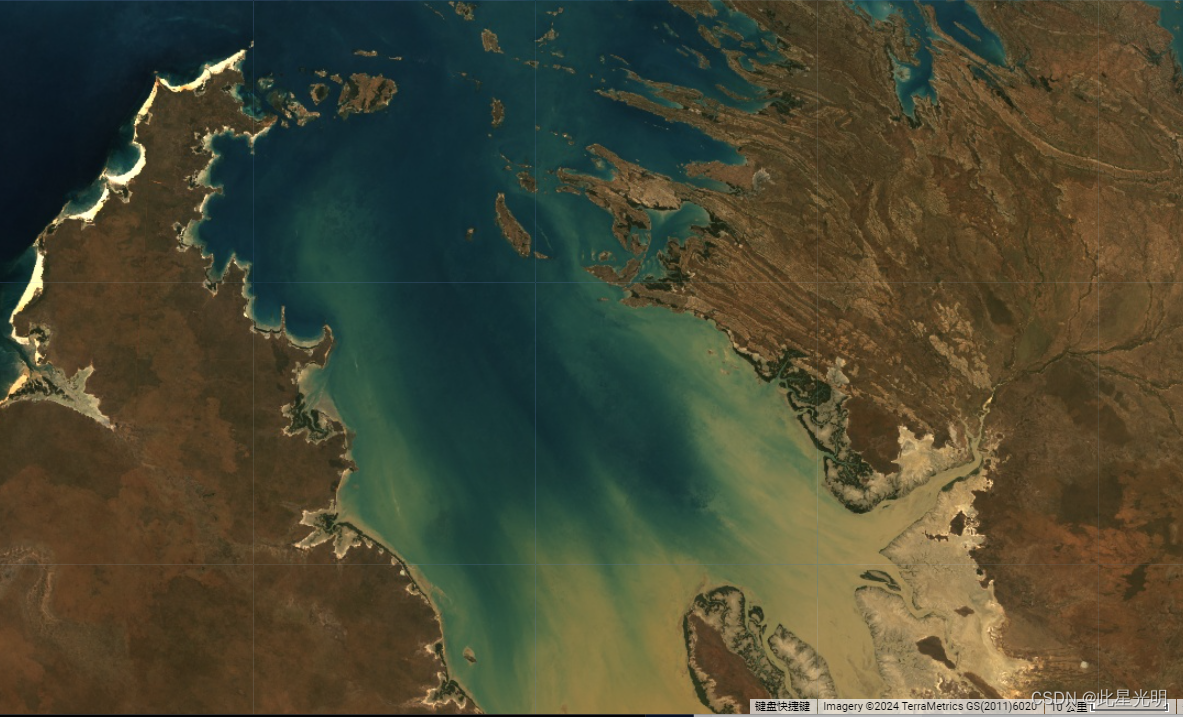
var geomedian_ls5 = ee.ImageCollection('projects/geoscience-aus-cat/assets/ga_ls5t_nbart_gm_cyear_3');

var geometry =
    /* color: #98ff00 */
    /* displayProperties: [
      {
        "type": "rectangle"
      }
    ] */
    ee.Geometry.Polygon(
      [[[121.15880998755823, -15.010654451073695],
        [121.15880998755823, -18.377531570740548],
        [125.81701311255823, -18.377531570740548],
        [125.81701311255823, -15.010654451073695]]], null, false);

var composite = geomedian_ls5.filterBounds(geometry)
                             .filterDate('1995-01-01', '1996-01-01')
                             .mosaic();

var visualization = {
  bands: ['red', 'green', 'blue'],
  min: 0,
  max: 3000
};

Map.centerObject(geometry, 10);
Map.addLayer(composite, visualization, '1995 True Color Composite');
引用
- Roberts, D., Mueller, N., & Mcintyre, A. (2017). High-dimensional pixel composites from earth observation time series. IEEE Transactions on Geoscience and Remote Sensing, 55(11), 6254-6264. doi:10.1109/TGRS.2017.2723896. Roberts, D., Dunn, B., & Mueller, N. (2018). Open data cube products using high-dimensional statistics of time series. IGARSS 2018 - 2018 IEEE International Geoscience and Remote Sensing Symposium, 8647-8650. doi:10.1109/IGARSS.2018.8518312.
本文参与 腾讯云自媒体同步曝光计划,分享自作者个人站点/博客。
原始发表:2024-04-04,如有侵权请联系 cloudcommunity@tencent.com 删除
评论
登录后参与评论
推荐阅读
目录
腾讯云开发者

Copyright © 2013 - 2026 Tencent Cloud. All Rights Reserved. 腾讯云 版权所有
深圳市腾讯计算机系统有限公司 ICP备案/许可证号:粤B2-20090059 ![]() 粤公网安备44030502008569号
粤公网安备44030502008569号
腾讯云计算(北京)有限责任公司 京ICP证150476号 | 京ICP备11018762号