带中间值标号和n个表的方框图
带中间值标号和n个表的方框图
提问于 2022-10-18 20:01:45
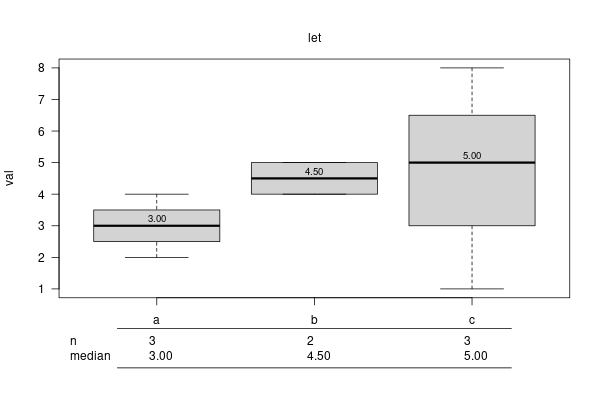
我喜欢创建一个带有中间标签的boxplot和一个中间值和n的汇总表(每组观察的数量),在底部和y轴标签旋转90度。
这是我的测试数据集
exampledf <- data.frame( val=c(4, 2, 3, 5, 4, 1, 5, 8),
                         let=c("a", "a", "a", "b", "b", "c", "c", "c") )
我能做这些
boxplot(val ~ let, data = exampledf)不知道如何旋转y轴标签90,添加中值值和下面的n表.预期数字

回答 1
Stack Overflow用户
回答已采纳
发布于 2022-10-18 20:31:51
我们可以使用boxplot的不可见输出来获得中介和ns。对于面板下面的中间标签和类表对象,我们可以使用text和mtext函数以及lines。我们最好使用png设备。
png('myplot.png', 600, 400)

par(mar=c(7, 4, 4, 2)+.1)

b <- boxplot(val ~ let, data=exampledf, xlab='', las=1)
mds <- b$stats[3, ]
text(1:3, mds + .225, labels=formatC(mds,format='f', digits=2), cex=.8)
mtext(c('n', b$n), 1, 2.5, at=c(.5, 1:3)-.05, adj=0)
mtext(c('median', formatC(mds,format='f', digits=2)), 1, 3.5, at=c(.5, 1:3)-.05, adj=0)
lines(c(.75, 3.25), c(-.25, -.25), xpd=TRUE)
lines(c(.75, 3.25), c(-1.5, -1.5), xpd=TRUE)
mtext('let', line=1)

dev.off()
页面原文内容由Stack Overflow提供。腾讯云小微IT领域专用引擎提供翻译支持
原文链接:
https://stackoverflow.com/questions/74119722
复制相关文章

![[设计]GUI设计规范的规范](https://ask.qcloudimg.com/http-save/yehe-3964600/8wqmco8j66.png)


相似问题
GUI设计器和代码视图
WinForms中的RX和模型视图演示器
学习WPF GUI设计
手工编写GUI或使用gui设计器工具
Winforms GUI (网格,chkboxlist)设计方法
添加站长 进交流群
领取专属 10元无门槛券
AI混元助手 在线答疑

关注 腾讯云开发者公众号
洞察 腾讯核心技术
剖析业界实践案例

腾讯云开发者

