Google Earth Engine——VNP13算法过程产生三种植被指数。(1)归一化差异植被指数(NDVI),(2)增强植被指数(EVI),以及(3)增强植被指数-2(EVI2)。

Google Earth Engine——VNP13算法过程产生三种植被指数。(1)归一化差异植被指数(NDVI),(2)增强植被指数(EVI),以及(3)增强植被指数-2(EVI2)。

此星光明
发布于 2024-02-02 09:58:00
发布于 2024-02-02 09:58:00
The Suomi National Polar-Orbiting Partnership (S-NPP) NASA Visible Infrared Imaging Radiometer Suite (VIIRS) Vegetation Indices (VNP13A1) data product provides vegetation indices by a process of selecting the best available pixel over a 16-day acquisition period at 500 meter resolution. The VNP13 data products are designed after the Moderate Resolution Imaging Spectroradiometer (MODIS) Terra and Aqua Vegetation Indices product suite to promote the continuity of the Earth Observation System (EOS) mission.
The VNP13 algorithm process produces three vegetation indices: (1) Normalized Difference Vegetation Index (NDVI), (2) the Enhanced Vegetation Index (EVI), and (3) Enhanced Vegetation Index-2 (EVI2). (1) NDVI is one of the longest continual remotely sensed time series observations, using both the red and near-infrared (NIR) bands. (2) EVI is a slightly different vegetation index that is more sensitive to canopy cover, while NDVI is more sensitive to chlorophyll. (3) EVI2 is a reformation of the standard 3-band EVI, using the red band and NIR band. This reformation addresses arising issues when comparing VIIRS EVI to other EVI models that do not include a blue band. EVI2 will eventually become the standard EVI.
Along with the three Vegetation Indices layers, this product also includes layers for near-infrared (NIR) reflectance; three shortwave infrared (SWIR) reflectance—red, blue, and green reflectance; composite day of year; pixel reliability; view and sun angles, and a quality layer.
For additional information, visit the VIIRS Land Product Quality Assessment website and see the User Guide.
Documentation:
- User's Guide
- Algorithm Theoretical Basis Document (ATBD)
- General Documentation 苏米国家极地轨道伙伴计划(S-NPP)NASA可见光红外成像辐射计套件(VIIRS)植被指数(VNP13A1)数据产品通过在500米分辨率下,在16天的采集期内选择最佳可用像素的过程提供植被指数。VNP13数据产品是在中分辨率成像光谱仪(MODIS)Terra和Aqua植被指数产品套件之后设计的,以促进地球观测系统(EOS)任务的延续性。 VNP13算法过程产生三种植被指数。(1)归一化差异植被指数(NDVI),(2)增强植被指数(EVI),以及(3)增强植被指数-2(EVI2)。(1) NDVI是持续时间最长的遥感时间序列观测之一,使用红色和近红外(NIR)波段。(2) EVI是一个稍有不同的植被指数,对树冠覆盖率更敏感,而NDVI对叶绿素更敏感。(3) EVI2是对标准的3波段EVI的改造,使用红波段和近红外波段。这一改革解决了在比较VIIRS EVI和其他不包括蓝色波段的EVI模型时出现的问题。EVI2最终将成为标准的EVI。 除了三个植被指数层,该产品还包括近红外(NIR)反射率层;三个短波红外(SWIR)反射率--红色、蓝色和绿色反射率;复合年日;像素可靠性;视角和太阳角度,以及质量层。 有关其他信息,请访问VIIRS土地产品质量评估网站,并查看用户指南。 文件。 用户指南 算法理论基础文件(ATBD) 一般文件
Dataset Availability
2012-01-17T00:00:00 - 2021-09-06T00:00:00
Dataset Provider
NASA LP DAAC at the USGS EROS Center
Collection Snippet
ee.ImageCollection("NOAA/VIIRS/001/VNP13A1")
Resolution
500 meters
Bands Table
Name | Description | Units | Wavelength | Scale |
|---|---|---|---|---|
EVI | 3 band Enhanced Vegetation Index | 0.0001 | ||
EVI2 | 2 band Enhanced Vegetation Index | 0.0001 | ||
NDVI | Normalized Difference Vegetation Index | 0.0001 | ||
NIR_reflectance | Near-infrared Radiation reflectance | 846-885nm | 0 | |
SWIR1_reflectance | Shortwave Infrared Radiation reflectance | 1230-1250nm | 0 | |
SWIR2_reflectance | Shortwave Infrared Radiation reflectance | 1580-1640nm | 0 | |
SWIR3_reflectance | Shortwave Infrared Radiation reflectance | 2225-2275nm | 0 | |
VI_Quality | Quality Assessment (QA) bit-field. | 0 | ||
VI_Quality Bitmask | Bits 0-1: MODLAND_QA 0: VI produced, good quality1: VI produced, but check other QA2: Pixel produced, but probably cloudy3: Pixel not produced due to other reason than cloudsBits 2-5: VI Usefulness, higher values are worse. 0: Highest Quality1: Lower quality2: Decreasing quality3: Decreasing quality4: Decreasing quality5: Decreasing quality6: Decreasing quality7: Decreasing quality8: Decreasing quality9: Decreasing quality10: Decreasing quality11: Decreasing quality12: Worst quality13: Quality so low that it is not useful14: L1B data faulty15: Not useful for any reason/not processedBits 6-7: Aerosol quantity 0: Climatology1: Low2: Average3: HighBit 8: Adjacent cloud detected 0: No1: YesBit 9: Adjacent BRDF correction performed 0: No1: YesBit 10: Mixed clouds 0: No1: YesBits 11-13: Land/Water Flag 0: land & desert1: land no desert2: inland water3: sea_water5: coastalBit 14: Possible snow/ice 0: No1: YesBit 15: Possible shadow 0: No1: Yes | |||
red_reflectance | Red band reflectance | 600-680nm | 0 | |
green_reflectance | Green band reflectance | 545-656nm | 0 | |
blue_reflectance | Blue band reflectance | 478-498nm | 0 | |
composite_day_of_the_year | Julian day of year | Day | 0 | |
pixel_reliability | Pixel usefulness using a simple rank class | 0 | ||
relative_azimuth_angle | Relative azimuth angle for each pixel | degrees | 0 | |
sun_zenith_angle | Sun zenith angle for each pixel | degrees | 0 | |
view_zenith_angle | View zenith angle for each pixel | degrees | 0 | |
- Bits 0-1: MODLAND_QA
- 0: VI produced, good quality
- 1: VI produced, but check other QA
- 2: Pixel produced, but probably cloudy
- 3: Pixel not produced due to other reason than clouds
- Bits 2-5: VI Usefulness, higher values are worse.
- 0: Highest Quality
- 1: Lower quality
- 2: Decreasing quality
- 3: Decreasing quality
- 4: Decreasing quality
- 5: Decreasing quality
- 6: Decreasing quality
- 7: Decreasing quality
- 8: Decreasing quality
- 9: Decreasing quality
- 10: Decreasing quality
- 11: Decreasing quality
- 12: Worst quality
- 13: Quality so low that it is not useful
- 14: L1B data faulty
- 15: Not useful for any reason/not processed
- Bits 6-7: Aerosol quantity
- 0: Climatology
- 1: Low
- 2: Average
- 3: High
- Bit 8: Adjacent cloud detected
- 0: No
- 1: Yes
- Bit 9: Adjacent BRDF correction performed
- 0: No
- 1: Yes
- Bit 10: Mixed clouds
- 0: No
- 1: Yes
- Bits 11-13: Land/Water Flag
- 0: land & desert
- 1: land no desert
- 2: inland water
- 3: sea_water
- 5: coastal
- Bit 14: Possible snow/ice
- 0: No
- 1: Yes
- Bit 15: Possible shadow
- 0: No
- 1: Yes
red_reflectanceRed band reflectance600-680nm0green_reflectanceGreen band reflectance545-656nm0blue_reflectanceBlue band reflectance478-498nm0composite_day_of_the_yearJulian day of yearDay0pixel_reliabilityPixel usefulness using a simple rank class0relative_azimuth_angleRelative azimuth angle for each pixeldegrees0sun_zenith_angleSun zenith angle for each pixeldegrees0view_zenith_angleView zenith angle for each pixeldegrees0
Class Table: pixel_reliability
Value | Color | Color Value | Description |
|---|---|---|---|
0 | # | Excellent | |
1 | # | Good | |
2 | # | Acceptable | |
3 | # | Marginal | |
4 | # | Pass | |
5 | # | Questionable | |
6 | # | Poor | |
7 | # | Cloud Shadow | |
8 | # | Snow/Ice | |
9 | # | Cloud | |
10 | # | Estimated | |
11 | # | LTAVG (taken from database) |
数据使用:
LP DAAC NASA data are freely accessible; however, when an author publishes these data or works based on the data, it is requested that the author cite the datasets within the text of the publication and include a reference to them in the reference list.
引用:
代码 :
var dataset = ee.ImageCollection("NOAA/VIIRS/001/VNP13A1");
var mean_evi_january_2018 = dataset
    .filterDate('2018-01-01', '2018-01-31')
    .select('EVI')
    .mean();
var evi_vis = {
  min: 0.0,
  max: 10000.0,
  palette: ["000", "040", "080", "0B0", "0F0"],
};
Map.setCenter(95.571, 27.808, 8);
Map.addLayer(mean_evi_january_2018, evi_vis, 'Mean EVI January 2018');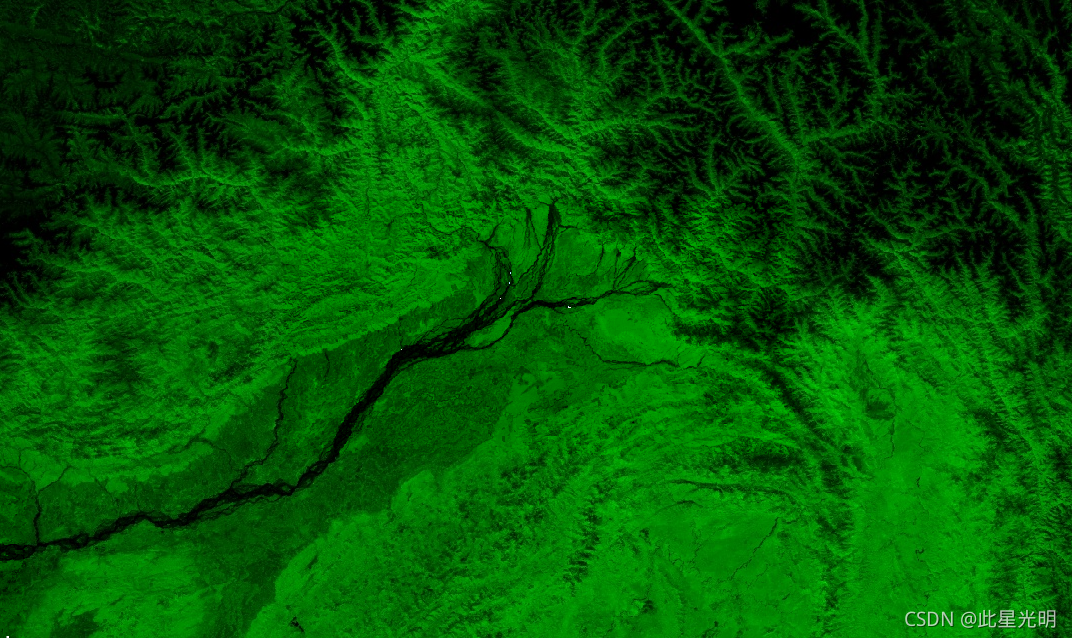
本文参与 腾讯云自媒体同步曝光计划,分享自作者个人站点/博客。
原始发表:2024-02-01,如有侵权请联系 cloudcommunity@tencent.com 删除
腾讯云开发者

Copyright © 2013 - 2026 Tencent Cloud. All Rights Reserved. 腾讯云 版权所有
深圳市腾讯计算机系统有限公司 ICP备案/许可证号:粤B2-20090059  粤公网安备44030502008569号
腾讯云计算(北京)有限责任公司 京ICP证150476号 | 京ICP备11018762号