

matplotlib:两种有两个轴的图表类型
提问于 2013-11-20 03:53:59

回答 1
Stack Overflow用户
回答已采纳
发布于 2013-11-20 05:37:27
您只需调用.plot(),就像调用一个正常的线条图一样。
对您所提及的示例做了轻微的修改:
import numpy as np
import matplotlib.pyplot as plt

N = 5
menMeans   = (20, 35, 30, 35, 27)
womenMeans = (25, 32, 34, 20, 25)
menStd     = (2, 3, 4, 1, 2)
womenStd   = (3, 5, 2, 3, 3)
ind = np.arange(N)    # the x locations for the groups
width = 0.35       # the width of the bars: can also be len(x) sequence

fig, ax = plt.subplots()

ax.bar(ind, menMeans,   width, color='r', yerr=womenStd,
             align='center', label='Woman')

ax.bar(ind, womenMeans, width, color='y', yerr=menStd,
             bottom=menMeans, align='center', label='Men')

ax.set_ylabel('Scores')
ax.set_title('Scores by group and gender')
ax.set_xticks(ind)
ax.set_xticklabels(('G1', 'G2', 'G3', 'G4', 'G5'))
ax.set_yticks(np.arange(0,81,10))

ax.plot(np.random.randint(20,50,5), 'o-', lw=2, color='k', label='Line')

ax.legend()
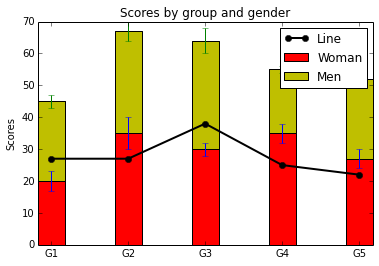
如果您想要一个单独的缩放,请在Matplotlib的示例页面上查看比例尺示例,这将在相同的轴(比例)上绘制这条线。
页面原文内容由Stack Overflow提供。腾讯云小微IT领域专用引擎提供翻译支持
原文链接:
https://stackoverflow.com/questions/20095240
复制相关文章


腾讯云开发者

