

有matplotlib.ticker.LogFormatterSciNotation的非数学版本吗?
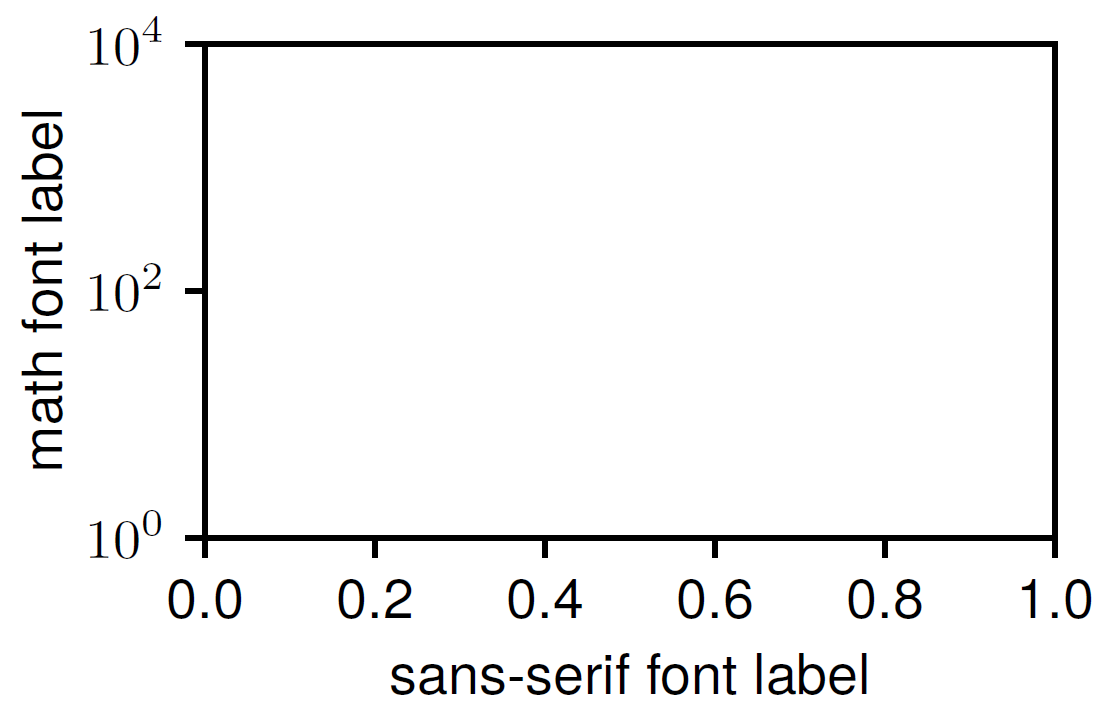
我试图用pgf_with_latex绘制一个带有对数y轴的图形,即所有文本格式都由pdflatex完成。在matplotlib rc参数中,我定义了要使用的字体。我的问题来了:标准的matplotlib.ticker.LogFormatterSciNotation格式化程序使用数学文本,因此使用数学字体,它不适合其他字体(sans-serif)。
如何使用来自matplotlib.ticker的格式化程序格式化y轴标签,以便将标签格式化为10的幂,并具有超纯的能力?更具体地说:我如何使这些these标签以相同的方式格式化,但使用来自xticklabels的字体?
我已经尝试过使用matplotlib.ticker提供的不同的格式化程序,但是它们中没有一个有我想要的指数。
下面是我用MWE表示的一个例子。
import matplotlib as mpl

mpl.use('pgf')
pgf_with_latex = {
        "pgf.texsystem": "pdflatex",
        "font.family": "sans-serif",
        "text.usetex": False,
        "pgf.preamble": [
            r"\usepackage[utf8x]{inputenc}",
            r"\usepackage{tgheros}",  # TeX Gyre Heros sans serif
            r"\usepackage[T1]{fontenc}"
            ]
        }

mpl.rcParams.update(pgf_with_latex)
import matplotlib.pyplot as plt

fig = plt.figure(figsize=[3, 2])
ax = fig.add_subplot(111)
ax.set_yscale("log")
ax.minorticks_off()
ax.set_xlabel("sans-serif font label")
ax.set_ylabel("math font label")
plt.gca().set_ylim([1, 10000])
plt.gcf().tight_layout()


plt.savefig('{}.pdf'.format("test"))
警告:必须在系统上安装TeX发行版才能运行此版本。我使用了MikTex 2.9。还有Python3.6.2和matplotlib 2.1.2。

回答 2
Stack Overflow用户
发布于 2018-09-14 16:44:58
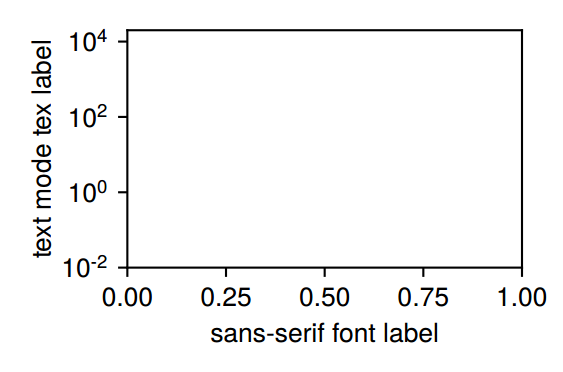
您可以将LogFormatterExponent子类格式化为"10\textsuperscript{x}",其中x是指数。这将不使用数学模式tex,即文本周围没有$符号,因此将使用序言中指定的文本字体(在本例中是没有衬线的字体)。
import matplotlib as mpl
from matplotlib.ticker import LogFormatterExponent

mpl.use('pgf')
pgf_with_latex = {
        "pgf.texsystem": "pdflatex",
        "font.family": "sans-serif",
        "text.usetex": False,
        "pgf.preamble": [
            r"\usepackage[utf8x]{inputenc}",
            r"\usepackage{tgheros}",  # TeX Gyre Heros sans serif
            r"\usepackage[T1]{fontenc}"
            ]
        }
mpl.rcParams.update(pgf_with_latex)
import matplotlib.pyplot as plt

class LogFormatterTexTextMode(LogFormatterExponent):
    def __call__(self, x, pos=None):
        x = LogFormatterExponent.__call__(self, x,pos)
        s = r"10\textsuperscript{{{}}}".format(x)
        return s

fig = plt.figure(figsize=[3, 2])
ax = fig.add_subplot(111)
ax.set_yscale("log")
ax.yaxis.set_major_formatter(LogFormatterTexTextMode())
ax.minorticks_off()
ax.set_xlabel("sans-serif font label")
ax.set_ylabel("text mode tex label")
plt.gca().set_ylim([0.01, 20000])
plt.gcf().tight_layout()


plt.savefig('{}.pdf'.format("test"))
Stack Overflow用户
发布于 2018-09-14 16:50:03
您可以定义自己的FuncFormatter,在unicode中执行科学表示法。
在this answer中给出了一个几乎完全的上标转换器。我刚加了减号。
下面是一个实现:
# -*- coding: utf-8 -*-
from math import log10

SUPERSCRIPTS = dict(zip(u"-0123456789", u"⁻⁰¹²³⁴⁵⁶⁷⁸⁹"))
def unicode_sci_notation(x, pos):
    """Scientific notation of number with unicode"""
    power = int(log10(x))
    mantissa = x/(10**power)
    superscript = u''.join(SUPERSCRIPTS[c] for c in unicode(power))
    if mantissa == 1:
        return '10%s' % superscript
    else:
        return '%.2f x 10%s' % (mantissa, superscript)
formatter = mpl.ticker.FuncFormatter(unicode_sci_notation)

ax.yaxis.set_major_formatter(formatter)
要这样做,您需要在脚本顶部指定代码: utf-8。如果您不想这样做,您可以像我链接的答案中所解释的那样,转义unicode字符。
https://stackoverflow.com/questions/52277797
复制


腾讯云开发者

