seaborn.catplot()色调不能正常工作
我正在尝试用一个seaborn.facetgrid替换一个seaborn.catplot。但是seaborn.catplot没有在Embarked = C方面正确地标注色调。
数据集:泰坦尼克号
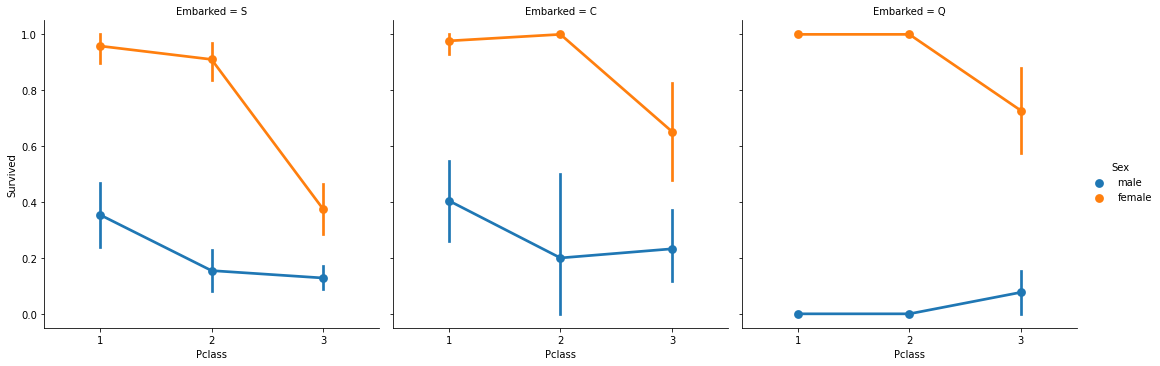
e = sns.FacetGrid(data= train_df, col='Embarked')
e.map_dataframe(sns.pointplot, 'Pclass', 'Survived', hue='Sex', palette='deep')
e.add_legend()
登船C:男性被正确地呈现为色调
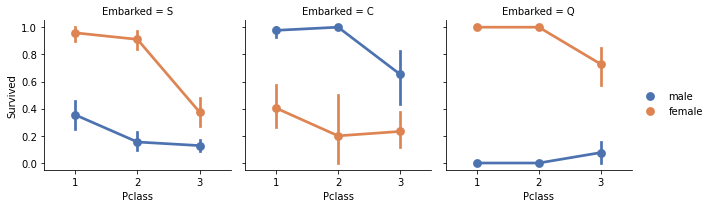
但我的seaborn.catplot显示:
sns.catplot(x='Pclass', y= 'Survived', hue='Sex', data=train_df, kind='point', col='Embarked')
登船C:男性没有正确地表示为色调
回答 2
Stack Overflow用户
发布于 2021-06-16 03:00:55
JohanC已经在他的评论中取笑了这个答案。我只会解释和完整。
以下是文档 of seaborn.catplot对订购的看法:
与底层绘图函数的情况一样,如果变量具有分类数据类型,则将从对象推断出分类变量的级别及其顺序。否则,您可能必须使用更改数据排序或使用函数参数(
orient、order、hue_order等)。正确设置情节。
这意味着您可以使用hue_order参数来确保按您希望的顺序排列绘图:
order,hue_order:字符串列表,可选的 为了在其中绘制分类级别,否则将从数据对象推断级别。
在这里,如何在您的情况下使用它:
sns.catplot(x='Pclass', y='Survived', hue='Sex', hue_order=['male', 'female'], data=train_df, kind='point', col='Embarked')或者,正如文档中所描述并由JohanC指出的,您可以将列train_df['Sex']的类型转换为绝对类型。然后,顺序将由seaborn推断。
Stack Overflow用户
发布于 2021-06-16 20:16:46
谢谢JohanC。是的,我的FacetGrid情节是错的。我手动检查过了。
train_df[(train_df['Embarked']=='C') & (train_df['Survived']==1)].groupby('Sex').count()['Survived']产出:
Sex
    female    64
male 29女性比男性大。在FacetGrid中,应该指定hue_order,否则可能会产生错误的结果。
页面原文内容由Stack Overflow提供。腾讯云小微IT领域专用引擎提供翻译支持
原文链接:
https://stackoverflow.com/questions/67996295
复制相关文章

![Rust 中 #[thread_local] 的drop方法不被调用](https://developer.qcloudimg.com/http-save/yehe-6807205/9e27b1f38ce349a7ab5198aa7e20919c.jpg)

![Macdown中[toc]无法生成目录解决方法](https://ask.qcloudimg.com/http-save/yehe-7727754/8suhyibuln.png)
点击加载更多
相似问题
角5延迟加载与动态加载
延迟加载与紧急加载
延迟加载:无法加载动态模块
动态加载延迟路由
延迟加载/动态绑定与安全性
添加站长 进交流群
领取专属 10元无门槛券
AI混元助手 在线答疑

关注 腾讯云开发者公众号
洞察 腾讯核心技术
剖析业界实践案例

腾讯云开发者
