反转百分比刻度
我正在尝试使用Matplotlib创建散点图,并希望反转轴的刻度标签(而不是轴本身)。我知道PercentFormatter(),但似乎没有一种方法可以在调用它之后反转标记。
我尝试手动设置刻度,将最大Y轴值的反转百分比值列表如下:
import matplotlib.pyplot as plt
positions = [
[4, 20, 12, 5],
[1, 10, 2, 9],
[8, 100, 40, 7],
[0, 15, 5, 3]
]
line_pos = 8
for line, len_line, g, t in positions:
gRel = g/len_line
tRel = t/len_line
pos = line_pos - line
plt.plot([gRel, gRel +tRel], [pos, pos])
l = [(j/line_pos)*100 for j in reversed(range(0, line_pos))]
locs, labels = plt.yticks()
plt.yticks(locs, l)
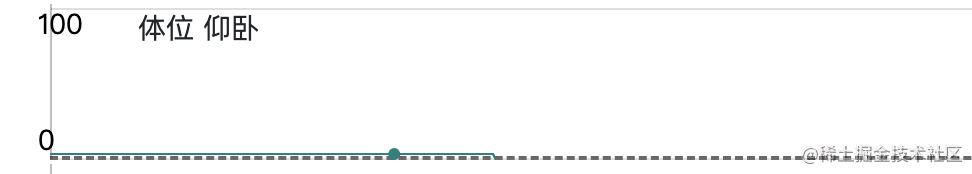
plt.show()但有些标记出现在刻度界限之外。

如何使用每个刻度标签的正确百分比来正确地反转这些标签?
提前感谢您的回答。
回答 1
Stack Overflow用户
发布于 2019-08-07 14:30:08
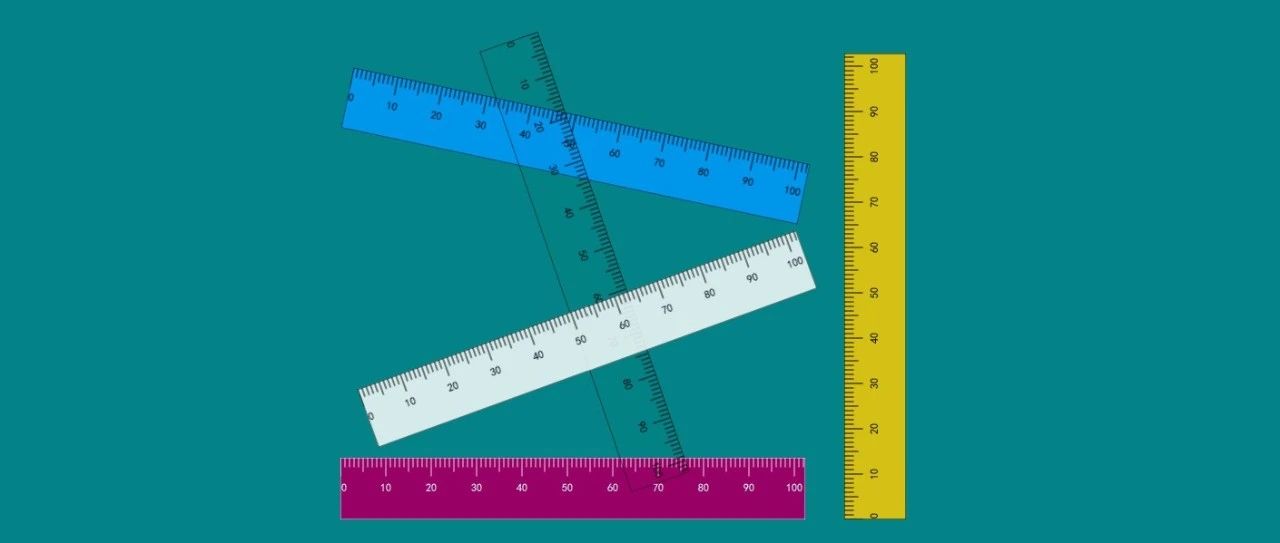
看起来这更像你想要的:
import matplotlib.pyplot as plt

positions = [
  [4, 20, 12, 5],
  [1, 10, 2, 9],
  [8, 100, 40, 7],
  [0, 15, 5, 3]
  ]
line_pos = 8

for line, len_line, g, t in positions:
  gRel = g/len_line
  tRel = t/len_line
  pos = line_pos - line
  plt.plot([gRel, gRel +tRel], [pos, pos])


locs = list(range(line_pos+1))
l = [(j/line_pos)*100 for j in reversed(locs)]

plt.yticks(locs, l)
plt.show()页面原文内容由Stack Overflow提供。腾讯云小微IT领域专用引擎提供翻译支持
原文链接:
https://stackoverflow.com/questions/57392705
复制
![[WPF] 使用 HandyControl 的 CirclePanel 画出表盘刻度](https://ask.qcloudimg.com/http-save/yehe-3964600/d51794ac4233363f1bfbf38efc3c0d1c.png)


相似问题
反转刻度顺序
绘制贴图:反转颜色刻度刻度值
反转数组的刻度
PHP如何反转数字刻度
反转曲线图时间刻度
添加站长 进交流群
领取专属 10元无门槛券
AI混元助手 在线答疑

关注 腾讯云开发者公众号
洞察 腾讯核心技术
剖析业界实践案例

社区富文本编辑器全新改版!诚邀体验~
全新交互,全新视觉,新增快捷键、悬浮工具栏、高亮块等功能并同时优化现有功能,全面提升创作效率和体验
腾讯云开发者
