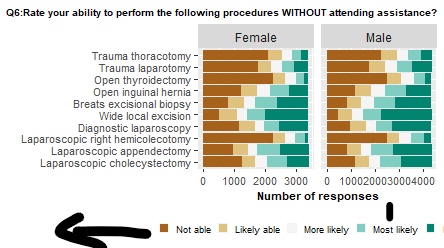
要向左移动的绘图图例
要向左移动的绘图图例
提问于 2020-04-02 18:40:53
我喜欢把图例移到左边一点,但我不知道怎么做。其次,我还想减少轴标签和图例之间的间距
你能给我一些建议吗?
下面给出了我正在使用的代码
图表的图像在下面的链接中
“工具提示”
ggplot(Q6_m, aes( choice,temp,fill=Answer ))+
  geom_bar(position = position_stack(reverse = TRUE), stat="identity") +
  coord_flip() +
  xlab("") +
  ylab("Number of responses") +
  scale_fill_brewer(type = "div") +
  theme(axis.text=element_text(size=8),
        axis.title=element_text(size=8,face="bold"), legend.title = element_blank(),
        legend.text=element_text(size=7)) +
  ggtitle("Q6:Rate your ability to perform the following procedures WITHOUT attending assistance?")+
  theme(plot.title = element_text(color = "black", size = 7.5, face = "bold", hjust = 1))+
  facet_wrap(~gender,scales = "free_x")+
  theme(legend.position="bottom", legend.direction  = "horizontal",legend.key.size = unit(0.5,"line")
)回答 1
Stack Overflow用户
回答已采纳
发布于 2020-04-02 22:02:07
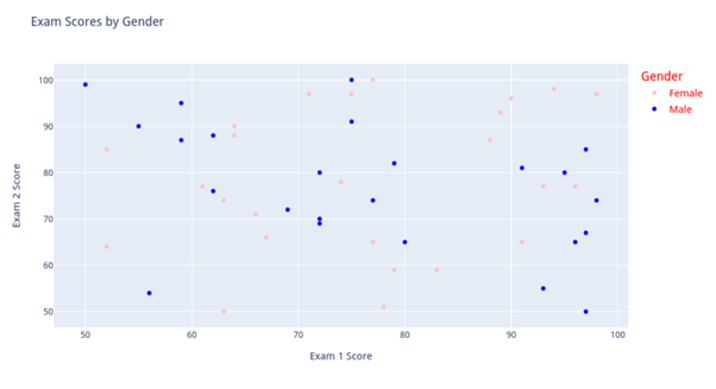
您应该使用legend.justification来获取绘图左侧的图例,使用legend.margin来减少轴标签和图例之间的间距:
ggplot(iris, aes(x = Species, y = Sepal.Length, fill = Species))+
  geom_boxplot()+
  theme(legend.position = "bottom",
        legend.justification = c(0,1),
        legend.margin = margin(t = -15, r = 0, b = 0, l = 0, unit = "pt"))

它回答了你的问题吗?
页面原文内容由Stack Overflow提供。腾讯云小微IT领域专用引擎提供翻译支持
原文链接:
https://stackoverflow.com/questions/60998784
复制


相似问题
如何使用mapCountryData创建绘图后移动图例
在python中移动xarray绘图行的图例。
将ggplot图例移动到离绘图更近的位置
图例的绘图问题
绘图图例问题
添加站长 进交流群
领取专属 10元无门槛券
AI混元助手 在线答疑

关注 腾讯云开发者公众号
洞察 腾讯核心技术
剖析业界实践案例

腾讯云开发者
