
戴图:无法为自定义图例div设置z索引
提问于 2018-07-19 23:40:50
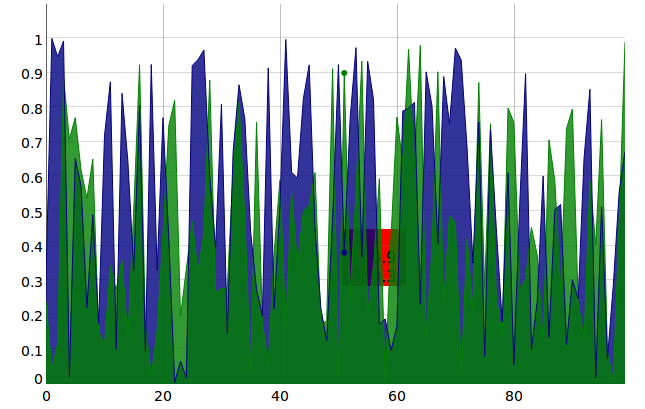
我正在尝试实现一个图形图例,它将跟随鼠标光标。它可以工作,但是有一个问题:图例div是在图形下面绘制的,这不是我想要的。
见以下MWE:
<!DOCTYPE html>
<html>
  <head>
    <title>Testing</title>
    <script src="static/dygraph.min.js"></script>
    <link rel="stylesheet" href="static/dygraph.css" />
    <style>
      #graph {
        height: 400px;
        width: 640px;
      }
      #legend {
        position: absolute;
        background-color: red;
        /* z-index: 99; */
      }
    </style>
  </head>
  <body>
    <div id="legend"></div>
    <div id="graph"></div>
    <script>
      document.onmousemove = function(e) {
        var legend = document.getElementById("legend");
        legend.style.left = e.pageX + "px";
        legend.style.top = e.pageY + "px";
      };

      var data = [];
      for(let i = 0; i < 100; i++) {
        data.push([i, Math.random(), Math.random()]);
      }
      var g = new Dygraph(
        "graph",
        data,
        {
          fillGraph: true,
          fillAlpha: 0.8,
          labels: ["x", "y1", "y2"],
          labelsDiv: legend,
          legendFormatter: legendFormatter
        }
      );

      function legendFormatter(data) {
        if(data.x === null) return "";
        return data.xHTML + "<br />" +
               data.series.map(
                 v => "<span style='color:" + v.color + ";'>" +
                    v.labelHTML + "</span>: " + v.yHTML
               ).join("<br />");
      }
    </script>
  </body>
</html>
下面的屏幕截图显示了当前的行为(这不是我想要的):
我的本能反应是创造一个更高的z指数。然而,这样做导致了一些奇怪的行为。
在Firefox中,这个传说就会消失。
在铬中,当光标静止时(在图表上),图例是不可见的,并且在光标移动时可以看到闪烁。
为什么是这样,以及如何使图例正确显示(在图表的顶部)?
当光标离开图形时,我仍然希望图例被隐藏,所以设置#legend { display: block !important; }不是一个选项。

回答 1
Stack Overflow用户
回答已采纳
发布于 2018-07-20 04:14:52
1)当图例div位于顶部并移动到光标位置时,
这就混淆了突出数据点的图形函数。
您会注意到,当图例div消失时,图上没有突出显示点。
这会引起闪烁..。
若要更正此问题,请向x,y位置添加几个像素,
因此,图例div不是直接在光标下面。
legend.style.left = (e.pageX + 16) + "px";
legend.style.top = (e.pageY + 16) + "px";
另外,鼠标会隐藏部分信息否则..。
2)将图例div放在图的顶部,而不添加z索引,
在dom后面,在图div之后添加图例div.
<div id="graph"></div>
<div id="legend"></div>3)见下面的工作片段..。
<!DOCTYPE html>
<html>
  <head>
    <title>Testing</title>
    <script src="https://cdnjs.cloudflare.com/ajax/libs/dygraph/2.1.0/dygraph.min.js"></script>
    <link rel="stylesheet" href="https://cdnjs.cloudflare.com/ajax/libs/dygraph/2.1.0/dygraph.css" />
    <style>
      #graph {
        height: 400px;
        width: 640px;
      }
      #legend {
        position: absolute;
        background-color: red;
      }
    </style>
  </head>
  <body>
    <div id="graph"></div>
    <div id="legend"></div>
    <script>
      var legend = document.getElementById("legend");
      document.onmousemove = function(e) {
        legend.style.left = (e.pageX + 16) + "px";
        legend.style.top = (e.pageY + 16) + "px";
      };

      var data = [];
      for(let i = 0; i < 100; i++) {
        data.push([i, Math.random(), Math.random()]);
      }
      var g = new Dygraph(
        "graph",
        data,
        {
          fillGraph: true,
          fillAlpha: 0.8,
          labels: ["x", "y1", "y2"],
          labelsDiv: legend,
          legendFormatter: legendFormatter,

        }
      );

      function legendFormatter(data) {
        //if(data.x === null) return "";
        return data.xHTML + "<br />" +
               data.series.map(
                 v => "<span style='color:" + v.color + ";'>" +
                    v.labelHTML + "</span>: " + v.yHTML
               ).join("<br />");
      }
    </script>
  </body>
</html>
页面原文内容由Stack Overflow提供。腾讯云小微IT领域专用引擎提供翻译支持
原文链接:
https://stackoverflow.com/questions/51437501
复制


腾讯云开发者
