
州人口合唱图
提问于 2018-11-01 12:13:11
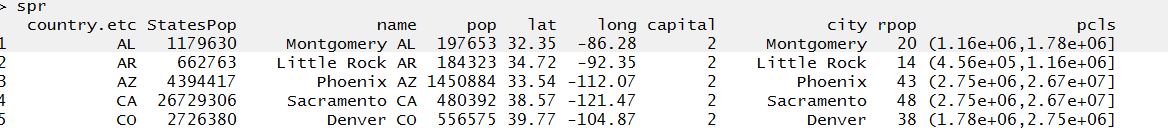
试图创建一张显示州人口的合唱图,同时也给首都贴上标签。最初我有两个数据框架,但无法将ggplot1添加到ggket2中,所以我将两个数据框架组合在一起,表的一部分如下所示:
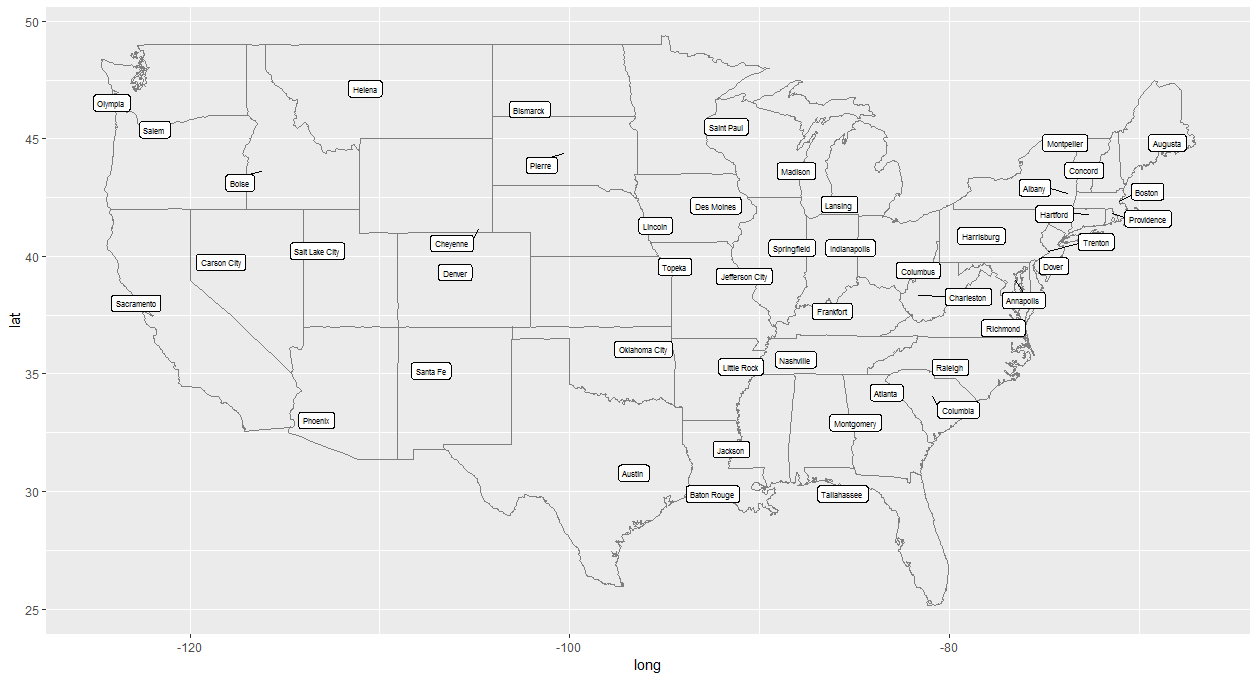
基本上,试图将这两幅图像组合在一起:
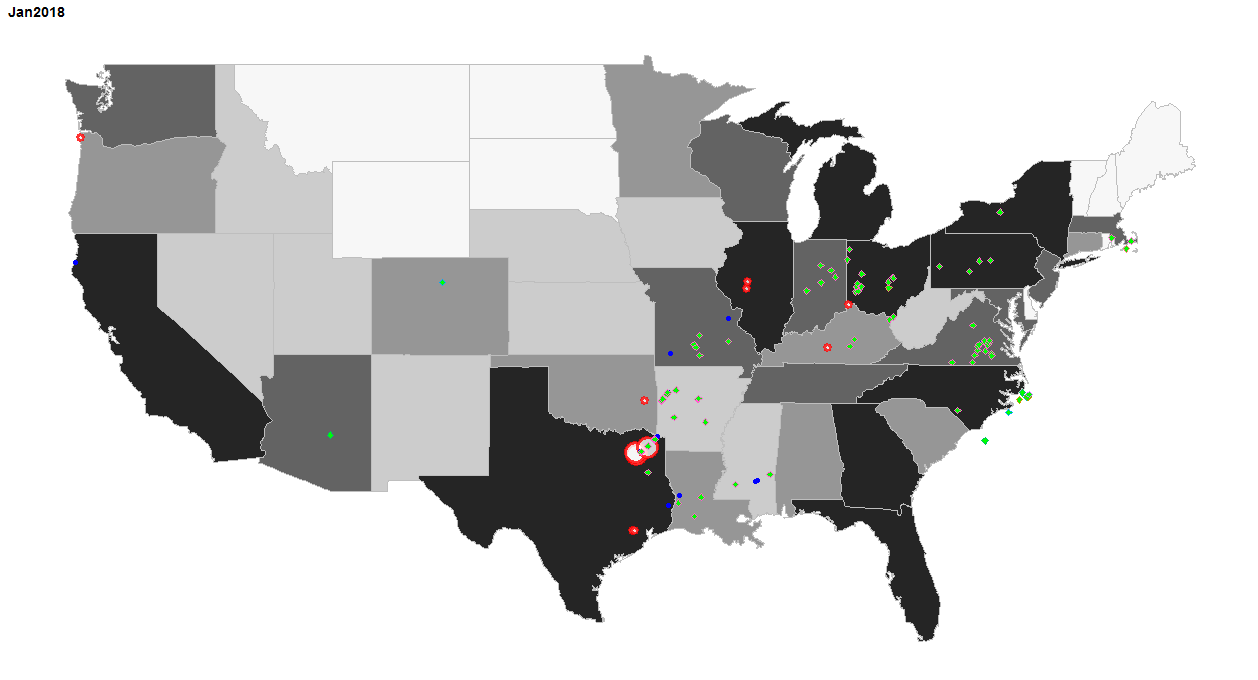
和
我写过
ggplot(spr, aes(long, lat)) + borders("state") + geom_point() +
coord_quickmap() +geom_label_repel(aes(label = city), size = 2) +
geom_polygon(aes(long, lat, group = capital, fill = pcls),color = "grey") +
coord_map("bonne", parameters=45) +ggthemes::theme_map() +
scale_fill_brewer(palette = "Reds")
但是地图看起来很差:
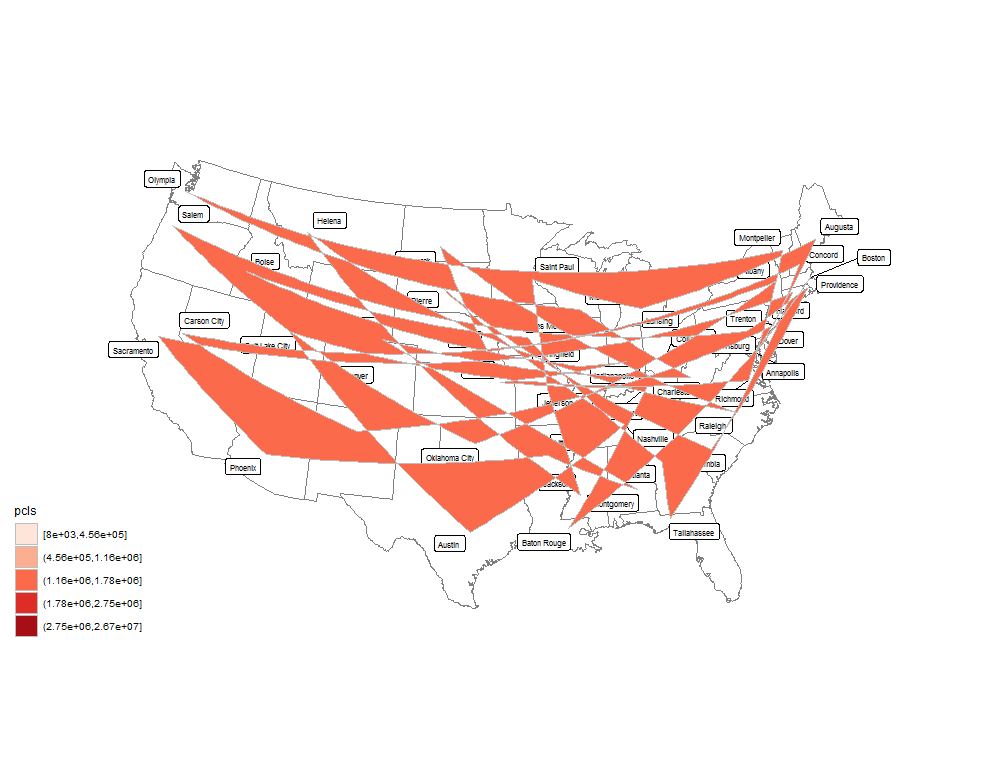
我认为这是多边形的一部分,让我放弃,但不知道如何处理它。

回答 1
Stack Overflow用户
回答已采纳
发布于 2018-11-01 13:36:07
您将需要shapefile,或者至少需要已知的边框来将数据映射到。
为了与您前几天的问题保持一致,您仍然可以使用state。scale_fill_brewer是为离散变量设计的。使用scale_fill_gradientn,指定brewer.pal。按需要在其中添加capitals层。
library(ggplot2)
library(usmap)
library(maps)
library(ggrepel)
library(ggthemes)
us <- map_data("state") # get the data to plot and map data to
data(statepop)
pops <- statepop
pops$full <- tolower(pops$full)
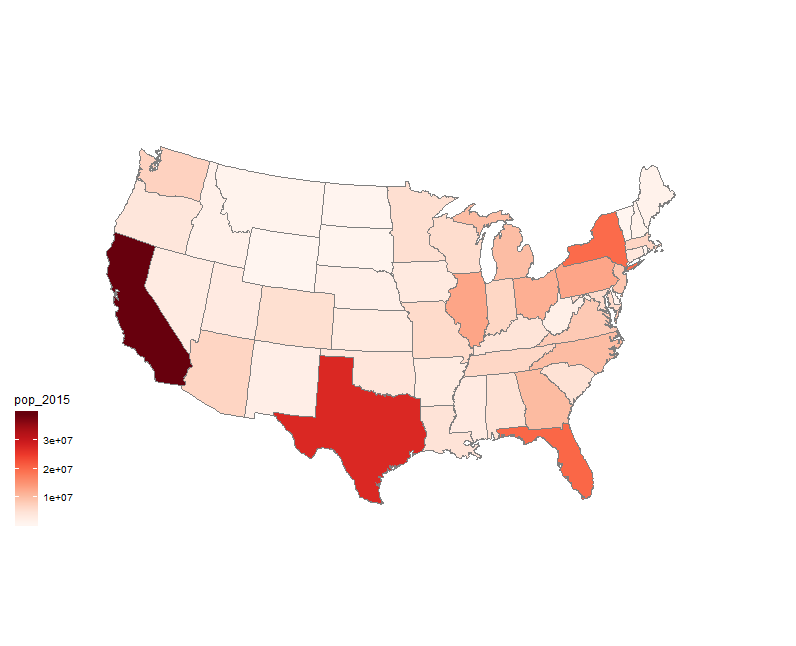
ggplot() + geom_map(data = us, map = us, aes(long, lat, map_id = region), fill = "#ffffff", color = "#ffffff", size = 0.15) +
geom_map(data = pops, map = us, aes(fill = pop_2015, map_id = full), size = 0.15) +
coord_map("bonne", parameters=45) +
scale_fill_gradientn(colors = brewer.pal(9, "Reds")) + #adjust the number as necessary
borders("state") +
ggthemes::theme_map()
页面原文内容由Stack Overflow提供。腾讯云小微IT领域专用引擎提供翻译支持
原文链接:
https://stackoverflow.com/questions/53108703
复制相关文章


腾讯云开发者

