
geom_smooth自定义线性模型
geom_smooth自定义线性模型
提问于 2017-06-26 21:22:09
在查看this问题时,我无法为geom_smooth指定一个自定义线性模型。我的代码如下:
example.label <- c("A","A","A","A","A","B","B","B","B","B")
example.value <- c(5, 4, 4, 5, 3, 8, 9, 11, 10, 9)
example.age <- c(30, 40, 50, 60, 70, 30, 40, 50, 60, 70)
example.score <- c(90,95,89,91,85,83,88,94,83,90)
example.data <- data.frame(example.label, example.value,example.age,example.score)

p = ggplot(example.data, aes(x=example.age,
                         y=example.value,color=example.label)) +
  geom_point()
  #geom_smooth(method = lm)

cf = function(dt){
  lm(example.value ~example.age+example.score, data = dt)
}

cf(example.data)

p_smooth <- by(example.data, example.data$example.label,
               function(x) geom_smooth(data=x, method = lm, formula = cf(x)))

p + p_smooth
我收到了以下错误/警告:
Warning messages:
1: Computation failed in `stat_smooth()`:
object 'weight' not found
2: Computation failed in `stat_smooth()`:
object 'weight' not found 我为什么要得到这个?以及向geom_smooth指定自定义模型的适当方法是什么。谢谢。
回答 1
Stack Overflow用户
回答已采纳
发布于 2017-06-27 08:26:53
具有两个连续预测变量和一个连续结果的回归模型的回归函数存在于一个三维空间中(两个是预测变量,一个是结果),而ggg图图是一个2D空间(x轴上有一个连续的预测器,y轴上有一个连续的结果)。这就是为什么不能用geom_smooth绘制两个连续预测变量的函数的根本原因。
一个“解决办法”是选择一个连续预测变量的几个特定值,然后为第一个变量的每个选定值在x轴上为另一个连续预测器绘制一条线。
下面是一个mtcars数据框架的示例。下面的回归模型使用wt和hp来预测wt。然后,我们绘制了mpg和wt对hp各种值的预测。我们创建一个预测的数据框架,然后使用geom_line进行绘图。图中的每一行表示mpg和wt对不同hp值的回归预测。当然,您也可以逆转wt和hp的角色。
library(ggplot)
theme_set(theme_classic())

d = mtcars
m2 = lm(mpg ~ wt + hp, data=d)

pred.data = expand.grid(wt = seq(min(d$wt), max(d$wt), length=20),
                        hp = quantile(d$hp))
pred.data$mpg = predict(m2, newdata=pred.data)

ggplot(pred.data, aes(wt, mpg, colour=factor(hp))) +
  geom_line() +
  labs(colour="HP Quantiles")

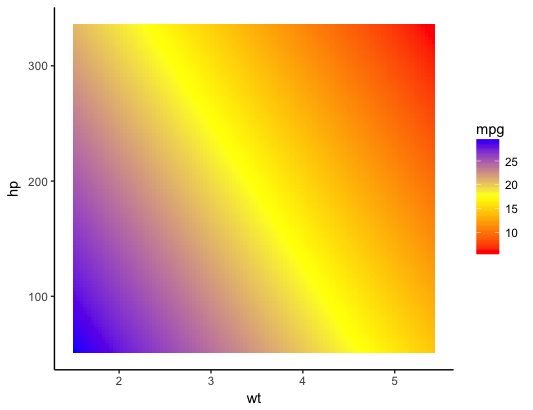
另一种选择是使用颜色梯度来表示mpg (结果),并在x和y轴上绘制wt和hp:
pred.data = expand.grid(wt = seq(min(d$wt), max(d$wt), length=100),
                        hp = seq(min(d$hp), max(d$hp), length=100))
pred.data$mpg = predict(m2, newdata=pred.data)

ggplot(pred.data, aes(wt, hp, z=mpg, fill=mpg)) +
  geom_tile() +
  scale_fill_gradient2(low="red", mid="yellow", high="blue", midpoint=median(pred.data$mpg))
页面原文内容由Stack Overflow提供。腾讯云小微IT领域专用引擎提供翻译支持
原文链接:
https://stackoverflow.com/questions/44772738
复制相关文章


相似问题
儿童道具反应元件
反应克隆儿童&附加不工作的道具
反应:无法更新儿童道具
特定儿童的阵列道具[反应]
道具儿童反应js没有定义。
添加站长 进交流群
领取专属 10元无门槛券
AI混元助手 在线答疑

关注 腾讯云开发者公众号
洞察 腾讯核心技术
剖析业界实践案例

腾讯云开发者

