R优雅的自定义绘制代谢通路图


❝最近看到一个非常好的案例来分享一下,使用igraph,ggraph等R包来自定义绘制代谢通路pathway, 原文文档链接见下方,数据可自行去官网下载。代码过程很是简洁,当然难点也许在于构建边文件与点文件。 这需要各位观众老爷细细品味 ❞
原文文档
❝https://github.com/cxli233/ggpathway❞
加载R包
library(tidyverse)
library(igraph)
library(ggraph)
library(readxl)
library(viridis)
library(RColorBrewer)
library(rcartocolor)
构建边数据
example1_edge_table <- tribble(
  ~from, ~to,  ~label,
  "Glc6P", "6P-gluconolactone",  "Glc6PHD",
  "6P-gluconolactone", "6P-glucoconate",  "6P-gluconolactonase",
  "6P-glucoconate", "Ru5P", "6P-gluconateDH"
)
# 构建点数据
example1_nodes_table <- tribble(
  ~name, ~x,  ~y,
  "Glc6P", 1, 0,
  "6P-gluconolactone", 2, 0,
  "6P-glucoconate", 3, 0,
  "Ru5P", 4, 0
)
文件整合
example1_network <- graph_from_data_frame(
  d = example1_edge_table,
  vertices = example1_nodes_table,
  directed = T
)
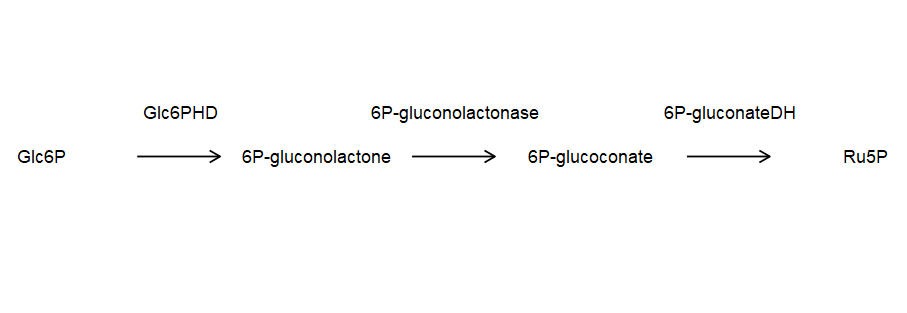
绘制基础通路图
ggraph(example1_network, layout = "manual",
       x = x, y = y) +
  geom_node_text(aes(label = name), hjust = 0.5) +
  geom_edge_link(aes(label = example1_edge_table$label),
                 angle_calc = 'along',
                 label_dodge = unit(2, 'lines'),
                 arrow = arrow(length = unit(0.5, 'lines')),
                 start_cap = circle(4, 'lines'),
                 end_cap = circle(4, 'lines')) +
  theme_void()
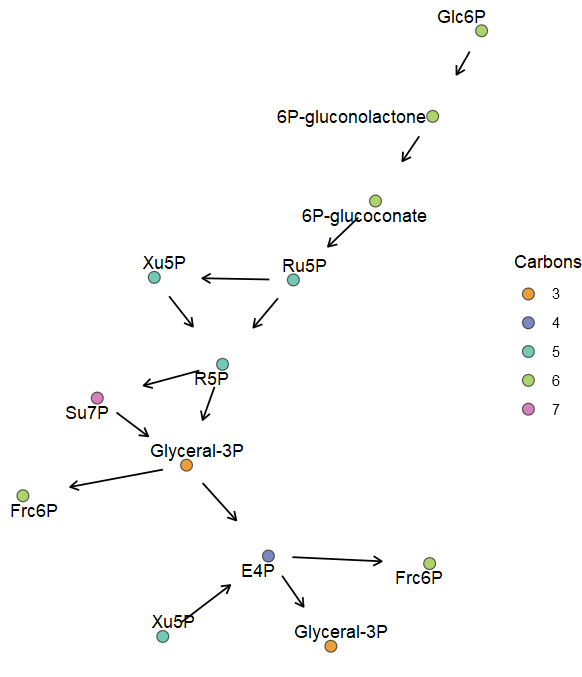
绘制PPP代谢途径
导入数据
example2_edges <- read_excel("OPPP_edges.xlsx")
example2_nodes <- read_excel("OPPP_nodes.xlsx")
构建新标签
example2_nodes <- example2_nodes %>%
  mutate(label = str_remove(name, "_\\d"))
文件整合
example2_network <- graph_from_data_frame(
  d = example2_edges,
  vertices = example2_nodes,
  directed = T)
绘制PPP代谢途径图
ggraph(example2_network, layout = "kk") +
  geom_node_point(size = 3, aes(fill = as.factor(carbons)),
                  alpha = 0.8, shape = 21, color = "grey20") +
  geom_node_text(aes(label = label), hjust = 0.5, repel = T) +
  geom_edge_link(label_dodge = unit(2, 'lines'),
    arrow = arrow(length = unit(0.4, 'lines')),
    start_cap = circle(1, 'lines'),
    end_cap = circle(2, 'lines')) +
  scale_fill_manual(values = carto_pal(7, "Vivid")) +
  labs(fill = "Carbons") +
  theme_void()
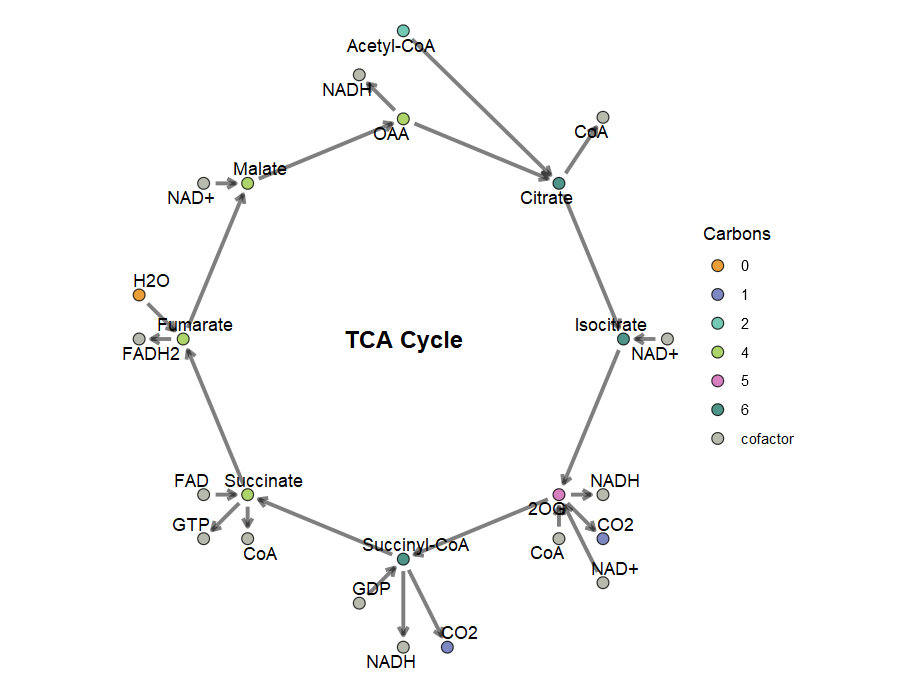
TCA途径
导入数据
example3_edges <- read_excel("TCA_cycle_edges.xlsx")
example3_nodes <- read_excel("TCA_cycle_nodes.xlsx")
构建标签文本
example3_nodes <- example3_nodes %>%
  mutate(label = str_remove(name, "_\\d"))
整合数据
example3_network <- graph_from_data_frame(
  d = example3_edges,
  vertices = example3_nodes,
  directed = T)
绘制TCA途径图
ggraph(example3_network, layout = "manual",
       x = x, y = y) +
  geom_node_point(size = 3, aes(fill = as.factor(carbons)),
                  alpha = 0.8, shape = 21, color = "black") +
  geom_edge_link(arrow = arrow(length = unit(0.4, 'lines')),
                 start_cap = circle(0.5, 'lines'),
                 end_cap = circle(0.5, 'lines'),
                 width = 1.1, alpha = 0.5) +
  geom_node_text(aes(label = label), hjust = 0.5, repel = T) +
  annotate(geom = "text", label = "TCA Cycle",
           x = 0, y = 0, size = 5, fontface = "bold") +
  scale_fill_manual(values = carto_pal(7, "Vivid")) +
  labs(fill = "Carbons") +
  theme_void() +
  coord_fixed()
本文参与 腾讯云自媒体同步曝光计划,分享自微信公众号。
原始发表:2022-12-05,如有侵权请联系 cloudcommunity@tencent.com 删除
评论
登录后参与评论
推荐阅读
目录
腾讯云开发者

Copyright © 2013 - 2026 Tencent Cloud. All Rights Reserved. 腾讯云 版权所有
深圳市腾讯计算机系统有限公司 ICP备案/许可证号:粤B2-20090059 ![]() 粤公网安备44030502008569号
粤公网安备44030502008569号
腾讯云计算(北京)有限责任公司 京ICP证150476号 | 京ICP备11018762号